
2023 , Vol. 20 >Issue 09: 916 - 922
DOI: https://doi.org/10.3877/cma.j.issn.1672-6448.2023.09.005
肾透明细胞癌高帧频超声造影时间-强度曲线特征分析
Copy editor: 吴春凤
收稿日期: 2023-06-05
网络出版日期: 2023-12-11
基金资助
江西省科技厅重点研发计划一般项目(20203BBGL73196)
江西省卫生健康委员会科技计划项目(202210452)
江西省中医药管理局科技计划项目(2021A060)
版权
Characteristics of time-intensity curve of high-frame-rate contrast-enhanced ultrasound in clear cell renal cell carcinoma
Received date: 2023-06-05
Online published: 2023-12-11
Copyright
探讨肾透明细胞癌(CCRCC)高帧频超声造影(H-CEUS)时间-强度曲线(TIC)特征及其临床应用价值。
选取2022年6月至2023年1月在南昌大学第一附属医院行常规超声造影(C-CEUS)及H-CEUS检查并经手术后病理确诊的CCRCC患者21例。回顾性分析C-CEUS及H-CEUS的TIC曲线特点,获得TIC参数,包括拟合程度(GOF)、基本强度(BI)、始增时间(AT)、达峰时间(TTP)、峰值强度(PI)、上升斜率(AS)、峰值强度减半时间(DT/2)、曲线下降斜率(DS)、曲线下面积(AUC)、平均渡越时间(MTT)。采用配对t检验比较2种超声造影模式下病灶与正常肾皮质的TIC参数差异;并用公式ΔPI=(病灶PI-正常肾皮质PI)/正常肾皮质PI进行校正,以此类推,分别对BI、AT、TTP、AS、DT/2、DS、AUC、MTT进行校正。采用配对Wilcoxon signed-rank检验对H-CEUS及C-CEUS校正后的TIC参数进行比较。
C-CEUS造影模式中病灶TIC参数PI、DS大于正常肾皮质[(49.93±6.02)dB vs(44.12±7.55)dB;0.24±0.14 vs 0.22±0.12],DT/2、MTT小于正常肾皮质[(140.38±26.51)s vs(150.98±29.27)s;(130.95±26.54)s vs(142.03±29.72)s],差异均具有统计学意义(t=5.300、-3.404、-4.139、-4.095,P<0.001、=0.003、=0.001、=0.001),参数GOF、BI、AT、TTP、AS、AUC差异均无统计学意义(P均>0.05)。H-CEUS造影模式中病灶TIC参数AT、TTP、AS、AUC均小于正常肾皮质[(9.41±2.73)s vs(10.40±3.03)s;(27.17±6.17)s vs(30.13±6.66)s;0.94±0.36 vs 1.07±0.39,3064.47±844.52 vs 3378.62±993.54],PI大于正常肾皮质[(43.34±8.69)dB vs(40.30±7.05)dB],差异均具有统计学意义(t=-3.465、-2.499、-2.688、-2.220、2.211,P=0.002、0.021、0.014、0.038、0.039),参数GOF、BI、DT/2、DS、MTT值差异无统计学意义(P均>0.05)。H-CEUS与C-CEUS校正后的TIC参数比较,H-CEUS的参数ΔAT、ΔAS、ΔAUC均小于C-CEUS[-0.072(-0.180,-0.022) vs -0.025(-0.054,0.053),-0.089(-0.190,0.083)vs 0.034(-0.016,0.074),-0.097(-0.256,-0.004)vs -0.045(-0.079,0.266)],差异具有统计学意义(Z=-2.242,-2.520,-2.033,P=0.025、0.012、0.042),ΔBI、ΔTTP、ΔPI、ΔDT/2、ΔDS、ΔMTT差异无统计学意义(P均>0.05)。CCRCC的H-CEUS TIC曲线形态呈弓背向上的弧形,上升支陡直,与正常肾皮质曲线的间距较大,消退较慢。
CCRCC的H-CEUS TIC曲线形态有一定特征,其灌注期参数ΔAT短于C-CEUS、ΔAS绝对值高于C-CEUS,可为临床进一步分析灌注期造影特征提供依据。
张卫平 , 王婧玲 , 刘志兴 , 陈莉 , 谌芳群 . 肾透明细胞癌高帧频超声造影时间-强度曲线特征分析[J]. 中华医学超声杂志(电子版), 2023 , 20(09) : 916 -922 . DOI: 10.3877/cma.j.issn.1672-6448.2023.09.005
To investigate the characteristics and clinical application of the time-intensity curve (TIC) of high-frame-rate contrast-enhanced ultrasound (H-CEUS) in clear cell renal cell carcinoma (CCRCC).
A total of 21 patients with CCRCC who underwent conventional contrast-enhanced ultrasound (C-CEUS) and H-CEUS examinations were selected at the First Affiliated Hospital of Nanchang University. TIC parameters of C-CEUS and H-CEUS were acquired and analyzed retrospectively, such as goodness of fit (GOF), base intensity (BI), arrival time (AT), time to peak (TTP), peak intensity (PI), ascending slope (AS), time to half peak intensity (DT/2), descending slope (DS), area under curve (AUC), and mean transit time (MTT). The paired t test was used to compare the TIC parameters of C-CEUS and H-CEUS between the lesions and the normal renal cortex. The equation ΔPI=(focal PI-normal renal cortex PI)/normal renal cortex PI was used for correction of BI, AT, TTP, AS, DT/2, DS, AUC, and MTT. Corrected TIC parameters of H-CEUS and C-CEUS were compared by the paired Wilcoxon signed-rank test.
The C-CEUS TIC parameters PI and DS of the lesions were significantly higher than those of the normal renal cortex [(49.93±6.02) dB vs (44.12±7.55) dB, t=5.300, P<0.001; 0.24±0.14 vs 0.22±0.12, t=-3.404, P=0.003], while DT/2 and MTT of the lesions were significantly smaller than those of the normal renal cortex [(140.38±26.51) s vs (150.98±29.27) s, t=-4.139, P=0.001; (130.95±26.54) s vs (142.03±29.72) s, t=-4.095, P=0.001]. There were no significant differences in GOF, BI, AT, TTP, AS, or AUC between the lesions and the normal renal cortex (P>0.05 for all). The H-CEUS TIC parameters AT, TTP, AS, and AUC of the lesions were significantly lower than those of the normal renal cortex [(9.41±2.73) s vs (10.40±3.03) s, t=-3.465, P=0.002; (27.17±6.17) s vs (30.13±6.66) s, t=-2.499, P=0.021; 0.94±0.36 vs 1.07±0.39, t=-2.688, P=0.014; 3064.47±844.52 vs 3378.62±993.54, t=-2.220, P=0.038], PI of the lesions was significantly greater than that of the normal renal cortex [(43.34±8.69) dB vs (40.30±7.05) dB, t=2.211, 0.039], while there was no statistically significant difference in GOF, BI, DT/2, DS, or MTT between the lesions and the normal renal cortex (P>0.05 for all). Comparing the corrected TIC parameters of H-CEUS with C-CEUS, ΔAT, ΔAS and ΔAUC of H-CEUS were significantly smaller than those of C-CEUS [-0.072 (-0.180, -0.022) vs -0.025 (-0.054, 0.053), Z=-2.242, P=0.025; -0.089 (-0.190, 0.083) vs 0.034 (-0.016, 0.074), Z=-2.520, P=0.012; -0.097 (-0.256, -0.004) vs -0.045 (-0.079, 0.266), Z=-2.033, P=0.042], while there were no significant differences in ΔBI, ΔTTP, ΔPI, ΔDT/2, ΔDS, or ΔMTT (P>0.05 for all). The TIC of H-CEUS of CCRCC was arching upward with a steep ascending branch and regressed slowly, and the distance between the TIC of the lesions and normal renal cortex was large.
The TIC of H-CEUS of CCRCC has certain characteristics. The perfusion period parameter ΔAT of H-CEUS is shorter than that of C-CEUS, but the absolute value of ΔAS is higher, which provides a basis for further analysis of contrast characteristics of the perfusion stage contrast features.
 表示,采用配对t检验分别对2种造影模式下的病灶与正常肾皮质TIC参数进行比较;肿瘤最大直径及校正后的TIC参数为不符合正态分布的计量资料,以M(QR)表示,采用配对Wilcoxon signed-rank检验比较C-CEUS和H-CEUS的差异。以P<0.05为差异具有统计学意义。
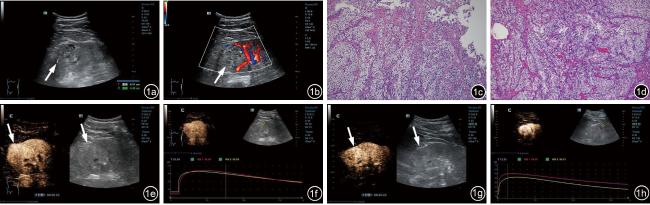
图1 44岁男性患者,左肾透明细胞癌常规超声、超声造影及病理图像。图a:常规超声见左肾上极低回声团,大小4.51 cm×4.42 cm,边界清晰,形态规则(箭头示病灶);图b:肿块内见点状血流信号,血流分级Ⅰ级(箭头示病灶);图c、d:病理诊断为肾透明细胞癌,世界卫生组织/国际泌尿病理学会分级为2级,镜下肿瘤细胞呈巢状分布,细胞核呈小圆形,胞浆空亮,期间见薄壁血管分布(HE×100);图e:常规超声造影(C-CEUS)灌注期23 s呈均匀性高增强(箭头示病灶);图f:C-CEUS时间-强度曲线(TIC)呈弓背向上的弧形,与正常肾皮质曲线的间距较小,消退较快(红色曲线为病灶,黄色曲线为正常肾皮质);图g:高帧频超声造影(H-CEUS)灌注期23 s呈均匀性高增强(箭头示病灶);图h:H-CEUS TIC呈弓背向上的弧形,上升支陡直,与正常肾皮质曲线的间距较大,消退较慢(红色曲线为病灶,黄色曲线为正常肾皮质) |
表1 21例肾透明细胞癌患者常规超声造影时间-强度曲线参数比较( |
| 参数 | 病灶 | 正常肾皮质 | t值 | P值 |
|---|---|---|---|---|
| GOF | 0.89±0.07 | 0.84±0.12 | 2.043 | 0.054 |
| BI(dB) | 4.58±3.10 | 4.34±2.43 | 0.430 | 0.672 |
| AT(s) | 8.87±1.32 | 8.98±1.49 | -0.841 | 0.410 |
| TTP(s) | 33.61±6.06 | 34.50±6.15 | -1.317 | 0.203 |
| PI(dB) | 49.93±6.02 | 44.12±7.55 | 5.300 | <0.001 |
| AS | 0.99±0.43 | 0.97±0.42 | 1.634 | 0.118 |
| DT/2(s) | 140.38±26.51 | 150.98±29.27 | -4.139 | 0.001 |
| DS | 0.24±0.14 | 0.22±0.12 | -3.404 | 0.003 |
| AUC | 5390.93±1264.84 | 5103.19±1214.51 | 1.104 | 0.283 |
| MTT(s) | 130.95±26.54 | 142.03±29.72 | -4.095 | 0.001 |
注:GOF为拟合程度,BI为基本强度,AT为始增时间,TTP为达峰时间,PI为峰值强度,AS为上升斜率,DT/2为峰值强度减半时间,DS为曲线下降斜率,AUC为曲线下面积,MTT为平均渡越时间 |
表2 21例肾透明细胞癌患者高帧频超声造影时间-强度曲线参数比较( |
| 参数 | 病灶 | 正常肾皮质 | t值 | P值 |
|---|---|---|---|---|
| GOF | 0.89±0.082 | 0.89±0.06 | -0.352 | 0.729 |
| BI(dB) | 11.42±6.24 | 11.37±4.95 | 0.056 | 0.956 |
| AT(s) | 9.41±2.73 | 10.40±3.03 | -3.465 | 0.002 |
| TTP(s) | 27.17±6.17 | 30.13±6.66 | -2.499 | 0.021 |
| PI(dB) | 43.34±8.69 | 40.30±7.05 | 2.211 | 0.039 |
| AS | 0.94±0.36 | 1.07±0.39 | -2.688 | 0.014 |
| DT/2(s) | 118.24±32.53 | 116.78±35.87 | 0.306 | 0.763 |
| DS | 0.18±0.13 | 0.19±0.086 | 0.769 | 0.451 |
| AUC | 3064.47±844.52 | 3378.62±993.54 | -2.220 | 0.038 |
| MTT(s) | 108.81±33.62 | 111.77±49.82 | -0.370 | 0.715 |
注:GOF为拟合程度,BI为基本强度,AT为始增时间,TTP为达峰时间,PI为峰值强度,AS为上升斜率,DT/2为峰值强度减半时间,DS为曲线下降斜率,AUC为曲线下面积,MTT为平均渡越时间 |
表3 21例肾透明细胞癌患者C-CEUS与H-CEUS时间-强度曲线校正后的参数比较[M(QR)] |
| 参数 | H-CEUS | C-CEUS | Z值 | P值 |
|---|---|---|---|---|
| ΔBI | 0.059(-0.212,0.229) | 0.052(-0.382,0.539) | -0.817 | 0.414 |
| ΔAT | -0.072(-0.180,-0.022) | -0.025(-0.054,0.053) | -2.242 | 0.025 |
| ΔTTP | -0.098(-0.098,0.060) | -0.034(-0.089,0.057) | -1.512 | 0.131 |
| ΔPI | 0.095(0.016,0.135) | 0.106(0.051,0.186) | -1.199 | 0.230 |
| ΔAS | -0.089(-0.190,0.083) | 0.034(-0.016,0.074) | -2.520 | 0.012 |
| ΔDT/2 | -0.015(-0.128,0.120) | -0.067(-0.125,-0.025) | -1.616 | 0.106 |
| ΔDS | -0.043(-0.142,0.101) | 0.077(0.024,0.125) | -1.929 | 0.054 |
| ΔAUC | -0.097(-0.256,-0.004) | -0.045(-0.079,0.266) | -2.033 | 0.042 |
| ΔMTT | -0.020(-0.143,0.223) | -0.074(-0.125,-0.027) | -1.547 | 0.122 |
注:C-CEUS为常规超声造影,H-CEUS为高帧频超声造影,ΔBI为校正基本强度,ΔAT为校正始增时间,ΔTTP为校正达峰时间,ΔPI为校正峰值强度,ΔAS为校正上升斜率,ΔDT/2为校正峰值强度减半时间,ΔDS为校正曲线下降斜率,ΔAUC为校正曲线下面积,ΔMTT为校正平均渡越时间 |
| 1 |
|
| 2 |
高琼, 何蒙娜, 蒋天安. 肾细胞癌常规超声及超声造影特征 [J]. 中国医学影像技术, 2021, 37(12): 1784-1788.
|
| 3 |
|
| 4 |
|
| 5 |
周祖邦, 谢金会, 李淑兰, 等. 超声造影对不同分期肾透明细胞癌诊断价值探讨 [J]. 中国超声医学杂志, 2015, 31(11): 997-999.
|
| 6 |
黄备建, 王文平, 丁红, 等. 小肾癌的超声造影表现 [J]. 中华超声影像学杂志, 2009, 18(5): 425-428.
|
| 7 |
胡蓉菲, 朱婷, 车欣, 等. 超声造影在不同病理亚型乏血供肾癌鉴别诊断中的价值 [J]. 中国超声医学杂志, 2020, 36(8): 703-706.
|
| 8 |
|
| 9 |
费翔, 罗渝昆, 李楠, 等. 高帧频超声造影在肝富血供占位性病变动脉期中的成像优势与临床价值 [J/OL]. 中华医学超声杂志(电子版), 2020, 17(9): 827-833.
|
| 10 |
郑丽丽, 任新平, 詹维伟, 等. 常规超声结合超声造影对肾透明细胞癌与肾血管平滑肌脂肪瘤的鉴别诊断价值 [J]. 第二军医大学学报, 2021, 42(6): 609-616.
|
| 11 |
|
| 12 |
|
| 13 |
梁舒媛, 罗渝昆, 费翔, 等. 高帧频超声造影在鉴别浅表淋巴结性质中的应用 [J/OL]. 中华医学超声杂志(电子版), 2020, 17(9): 841-847.
|
| 14 |
韩鹏, 费翔, 罗渝昆, 等. 高帧频超声造影在鉴别诊断胆囊腺瘤性息肉与胆固醇性息肉中的临床应用 [J/OL]. 中华医学超声杂志(电子版), 2020, 17(9): 815-820.
|
| 15 |
|
| 16 |
|
| 17 |
|
/
| 〈 |
|
〉 |
 )
) )
)