
2023 , Vol. 20 >Issue 09: 930 - 938
DOI: https://doi.org/10.3877/cma.j.issn.1672-6448.2023.09.007
超声造影与普美显磁共振成像对具有高危因素的≤3 cm肝结节进行LI-RADS分类诊断的前瞻性研究
Copy editor: 吴春凤
收稿日期: 2022-06-24
网络出版日期: 2023-12-11
基金资助
国家自然科学基金(82371986)
天津市卫生健康科技项目(MS20017)
天津市医学重点学科(专科)建设项目(TJYXZDXK-074C)
版权
Contrast-enhanced ultrasound versus gadoxetic acid-enhanced magnetic resonance imaging for LI-RADS classification of focal liver lesions ≤3 cm in patients at high risk of hepatocellular carcinoma: a prospective study
Received date: 2022-06-24
Online published: 2023-12-11
Copyright
比较超声造影(CEUS)和普美显磁共振成像(EOB-MRI)两者肝脏影像报告和数据系统(LI-RADS)对具有肝细胞癌(HCC)高危因素的≤3 cm的肝局灶性病变分类的一致性和诊断效能。
前瞻性收集天津市第三中心医院同时接受CEUS和EOB-MRI检查且具有HCC高危因素的结节直径≤3 cm的病例。在对患者信息、病理及相关检查均未知的情况下,对每个肝结节的CEUS及EOB-MRI图像进行观察,利用Kappa值评估观察者间一致性,分别按照CEUS LI-RADS(2017年版)及CT/MRI LI-RADS(2018年版)标准对结节进行分类。恶性病灶诊断以病理结果、良性病灶以病理结果和(或)随访作为参考标准,计算2种影像方式LI-RADS分类的诊断效能,利用χ2检验及Z检验比较两者诊断效能的差异。
107例114个结节满足入排标准。CEUS、EOB-MRI分类中LR-5、LR-4、LR-3和LR-M类结节的数量分别占45.6%、11.4%、19.3%、23.7%和25.4%、57.9%、10.5%、6.1%,2种影像方式对结节分类的一致性较差(Kappa=0.17,P<0.001)。CEUS LI-RADS和EOB-MRI LI-RADS分类各自观察者之间一致性良好(Kappa=0.83、0.77,P<0.001)。CEUS和EOB-MRI LR-5、LR-4、LR-3类对HCC的阳性预测值分别为98.1%、38.5%、13.6%和100%、71.2%、16.7%。CEUS和EOB-MRI LR-5类诊断HCC的敏感度、特异度、曲线下面积(AUC)分别为64.6%、97.1%、0.81和36.7%、100%、0.68。两者的阳性预测值、特异度差异均无统计学意义,AUC差异具有统计学意义(Z=4.29,P<0.01)。
CEUS和EOB-MRI对≤3 cm肝结节的分类一致性较差;两者各自LI-RADS分类不同观察者之间一致性较好。CEUS与EOB-MRI LR-5类对≤3 cm HCC具有同等良好的阳性预测值和特异度。
关键词: 肝细胞癌; 超声造影; 普美显磁共振成像; 肝脏影像报告及数据系统
丁建民 , 秦正义 , 张翔 , 周燕 , 周洪雨 , 王彦冬 , 经翔 . 超声造影与普美显磁共振成像对具有高危因素的≤3 cm肝结节进行LI-RADS分类诊断的前瞻性研究[J]. 中华医学超声杂志(电子版), 2023 , 20(09) : 930 -938 . DOI: 10.3877/cma.j.issn.1672-6448.2023.09.007
To compare the consistency and diagnostic performance of contrast-enhanced ultrasound (CEUS) versus gadoxetic acid-enhanced magnetic resonance imaging (EOB-MRI) in liver imaging reporting and data system (LI-RADS) classification of focal liver lesions ≤3 cm in patients at high risk of hepatocellular carcinoma (HCC).
Patients with focal liver lesions ≤3 cm at high risk of HCC who underwent CEUS and EOB-MRI at Tianjin Third Central Hospital were prospectively collected. The CEUS and EOB-MRI images of each liver nodule were observed to evaluate interobserver consistency using kappa coefficient and category according to the CEUS LI-RADS V2017 and CT/MRI LI-RADS V2018 criteria in a double blind manner. Pathology was used as the reference standard of malignant lesions and pathology and/or follow-up results were used as the reference standard for benign lesions to calculate the diagnostic performance of the two modalities, and χ2 test and Z test were used to compare the difference between the two modalities.
A total of 114 nodules of 107 cases met the inclusion criteria. The proportions of LR-5, LR-4, LR-3, and LR-M diagnosed by CEUS and EOB-MRI accounted for 45.6%, 11.4%, 19.3%, and 23.7%, and 25.4%, 57.9%, 10.5%, and 6.1%, respectively. The consistency of nodule classification between the two modalities was poor (Kappa=0.17, P<0.001). There was good consistency between readers on CEUS LI-RADS and EOB-MRI LI-RADS (Kappa=0.83 and 0.77, P<0.001). The positive predictive values of CEUS and EOB-MRI LR-5, LR-4, and LR-3 for HCC were 98.1%, 38.5%, and 13.6%, and 100%, 71.2%, and 16.7%, respectively. The sensitivity, specificity, and area under the curve (AUC) of CEUS and EOB-MRI LR-5 for HCC were 64.6%, 97.1%, and 0.81, and 36.7%, 100%, and 0.68, respectively. The was no statistical difference in the positive predictive value or specificity between the two groups, while the difference of AUC was statistically significant (Z=4.29, P<0.01).
CEUS and EOB-MRI have poor consistency in classification of liver nodules ≤ 3 cm. The consistency between readers is good. CEUS and EOB-MRI LR-5 have equally good diagnostic performance for HCC ≤ 3 cm.
Key words: Hepatocellular carcinoma; Contrast-enchanced ultrasound; EOB-MRI; LI-RADS
 表示,计数资料以百分数表示。评估CEUS与EOB-MRI LIRADS对HCC的诊断效能,计算准确性、敏感度、特异度、阳性预测值、阴性预测值,利用χ2检验比较2种影像模式间的差异。对结节的诊断效能采用受试者操作特征(receiver operating characteristic,ROC)曲线分析,ROC曲线下面积的比较采用Z检验。检查方法及观察者间一致性评价采用Cohen's Kappa系数进行比较分析(0~0.20不可信,0.21~0.40较低,0.41~0.60中等,0.61~0.80较高,0.81~1.00高)。P<0.05为差异具有统计学意义。
表1 超声造影肝脏影像报告和数据系统分类观察者之间一致性评价(个) |
| 观察组2 | 观察者1 | 总计 | |||
|---|---|---|---|---|---|
| LR-3 | LR-4 | LR-5 | LR-M | ||
| LR-3 | 22 | 0 | 0 | 0 | 22 |
| LR-4 | 0 | 10 | 1 | 1 | 12 |
| LR-5 | 0 | 3 | 46 | 3 | 52 |
| LR-M | 0 | 1 | 4 | 23 | 28 |
| 总计 | 22 | 13 | 51 | 28 | 114 |
表2 普美显磁共振成像肝脏影像报告和数据系统分类观察者之间一致性评价(个) |
| 观察者2 | 观察者1 | 总计 | |||
|---|---|---|---|---|---|
| LR-3 | LR-4 | LR-5 | LR-M | ||
| LR-3 | 12 | 0 | 0 | 0 | 12 |
| LR-4 | 1 | 52 | 8 | 3 | 64 |
| LR-5 | 0 | 4 | 28 | 0 | 32 |
| LR-M | 0 | 0 | 0 | 6 | 6 |
| 总计 | 13 | 56 | 36 | 9 | 114 |
表3 超声造影和普美显磁共振成像肝脏影像报告和数据系统分类结果对照(个) |
| 超声造影 | 普美显磁共振成像 | 总计 | |||
|---|---|---|---|---|---|
| LR-3 | LR-4 | LR-5 | LR-M | ||
| LR-3 | 9 | 12 | 0 | 1 | 22 |
| LR-4 | 3 | 8 | 1 | 1 | 13 |
| LR-5 | 0 | 32 | 19 | 1 | 52 |
| LR-M | 0 | 14 | 9 | 4 | 27 |
| 总计 | 12 | 66 | 29 | 7 | 114 |
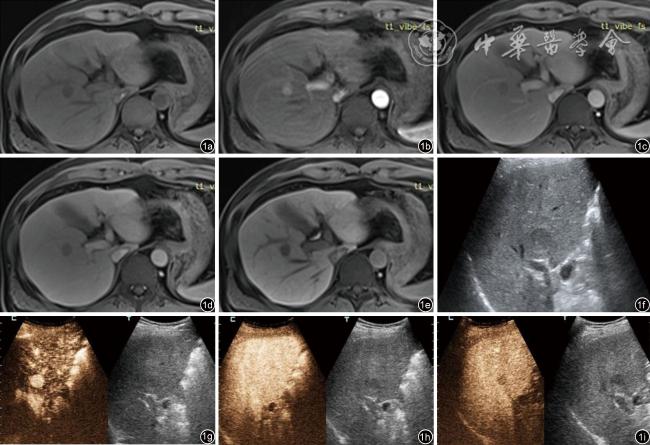
图1 患者男性,43岁,肝S5-8区病灶,大小1.7 cm×1.6 cm,既往乙肝肝硬化病史。EOB-MRI分类LR-5类:图a示T1加权成像扫查发现S5-8区结节呈低信号;图b:结节在动脉期明显强化呈高信号;图c示门脉期出现廓清,呈低信号;图d示移行期呈低信号;图e示肝胆期呈低信号;图f示常规超声扫查发现S5-8区低回声结节;CEUS分类LR-5类:图g示动脉期表现为高增强;图h示门脉期60 s未见廓清;图i示延迟期呈低增强。超声引导下穿刺组织学活检病理结果为高分化肝细胞癌 |
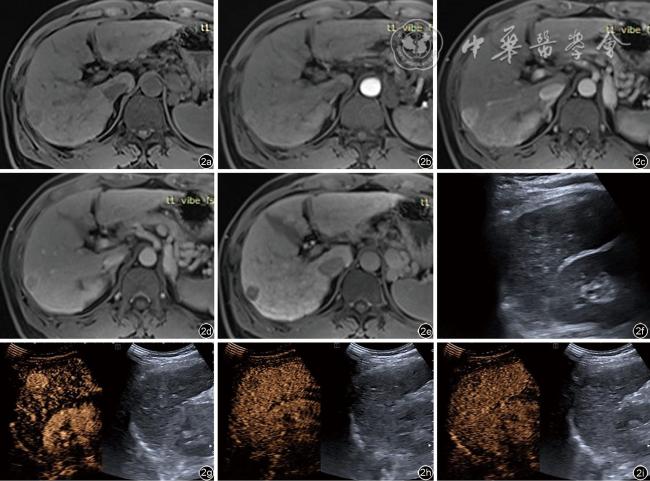
图2 患者男性,51岁,肝S6区病灶,大小2.0 cm×1.6 cm,既往乙肝肝硬化病史。EOB-MRI分类LR-4类:图a示T1加权成像扫查发现S6区结节呈稍低信号,欠均匀;图b示结节在动脉期轻度强化呈高信号,欠均匀;图c示门脉期呈高信号;图d示移行期呈等信号,欠均匀;图e示肝胆期呈低信号;图f示常规超声扫查发现S6区低回声结节;CEUS分类LR-M类:图g示动脉期表现为高增强;图h示门静脉期58 s开始廓清;图i示延迟期呈低增强。超声引导下穿刺组织学活检病理结果为高分化肝细胞癌 |
表4 超声造影与普美显磁共振成像肝脏影像报告和数据系统分类结果与病理对照(个) |
| 病理 | 超声造影 | 合计 | 普美显磁共振成像 | 合计 | ||||||
|---|---|---|---|---|---|---|---|---|---|---|
| LR-3 | LR-4 | LR-5 | LR-M | LR-3 | LR-4 | LR-5 | LR-M | |||
| 肝细胞癌 | 3 | 5 | 51 | 20 | 79 | 2 | 47 | 29 | 1 | 79 |
| 肝内胆管细胞癌 | 0 | 0 | 0 | 4 | 4 | 0 | 2 | 0 | 2 | 4 |
| 混合细胞癌 | 0 | 0 | 0 | 2 | 2 | 0 | 0 | 0 | 2 | 2 |
| 神经内分泌肿瘤 | 0 | 0 | 0 | 1 | 1 | 0 | 1 | 0 | 0 | 1 |
| 再生结节 | 2 | 2 | 0 | 0 | 4 | 1 | 2 | 0 | 1 | 4 |
| 不典型增生结节 | 4 | 2 | 1 | 0 | 7 | 2 | 5 | 0 | 0 | 7 |
| 局灶性结节样增生 | 0 | 1 | 0 | 0 | 1 | 0 | 1 | 0 | 0 | 1 |
| 血管瘤 | 0 | 1 | 0 | 0 | 1 | 0 | 1 | 0 | 0 | 1 |
| 其他良性 | 13 | 2 | 0 | 0 | 15 | 7 | 7 | 0 | 1 | 15 |
| 合计 | 22 | 13 | 52 | 27 | 114 | 12 | 66 | 29 | 7 | 114 |
表5 CEUS与EOB-MRI的LR-5、LR-M类诊断效能比较 |
| 分类方式 | 敏感度(%) | 特异度(%) | 阳性预测值(%) | 阴性预测值(%) | 曲线下面积 |
|---|---|---|---|---|---|
| HCC | |||||
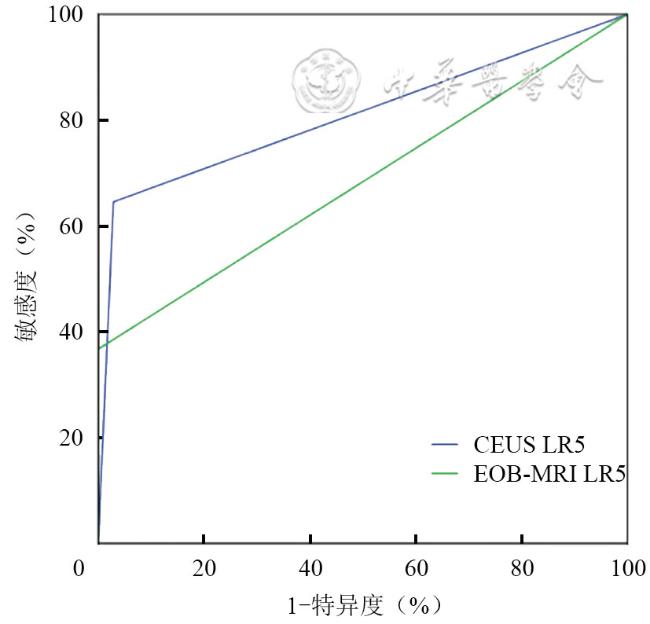
| CEUS LR-5 | 64.6 | 97.1 | 98.1 | 54.8 | 0.81 |
| EOB-MRI LR-5 | 36.7 | 100 | 100 | 41.2 | 0.68 |
| χ2值 | 13.81 | 1.01 | 0.56 | 2.69 | 4.29 |
| P值 | <0.001 | 0.314 | 0.452 | 0.101 | <0.001 |
| 非HCC恶性肿瘤 | |||||
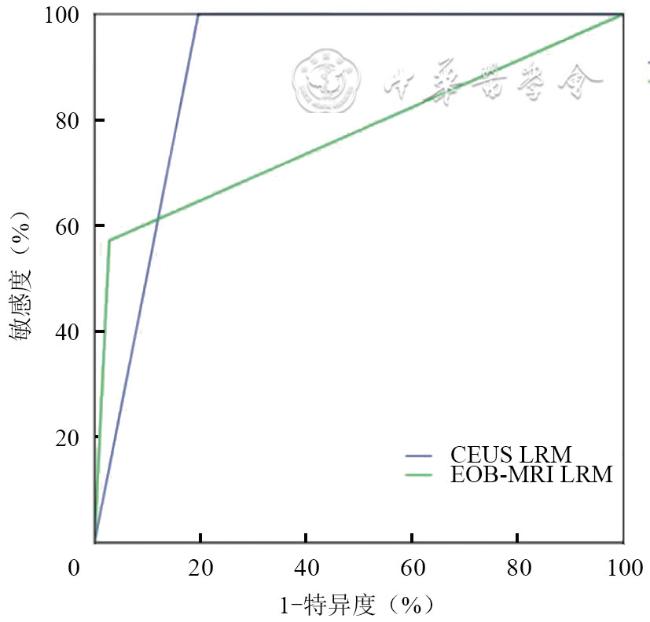
| CEUS LR-M | 100 | 81.3 | 25.9 | 100 | 0.91 |
| EOB-MRI LR-M | 57.1 | 97.2 | 57.1 | 97.2 | 0.77 |
| χ2值 | 3.82 | 14.10 | 2.48 | 2.48 | 1.21 |
| P值 | 0.048 | <0.001 | 0.114 | 0.115 | 0.201 |
注:CEUS为超声造影,EOB-MRI为普美显磁共振成像;HCC为肝细胞癌;LR-5为肝脏影像报告和数据系统分类明确为HCC,LR-M为可能确定为恶性但不特指HCC |
| 1 |
|
| 2 |
|
| 3 |
|
| 4 |
|
| 5 |
|
| 6 |
|
| 7 |
|
| 8 |
American College of Radiology. CEUS Liver Imaging Reporting and Data System Version 2018 [EB/OL]. Accessed May 25 2022.
|
| 9 |
American College of Radiology. CT/MRI Liver Imaging Reporting and Data System Version 2018 [EB/OL]. Accessed May 25 2022.
|
| 10 |
|
| 11 |
|
| 12 |
|
| 13 |
|
| 14 |
|
| 15 |
|
| 16 |
|
| 17 |
|
| 18 |
|
| 19 |
|
| 20 |
|
| 21 |
|
| 22 |
|
/
| 〈 |
|
〉 |