
2024 , Vol. 21 >Issue 03: 310 - 318
DOI: https://doi.org/10.3877/cma.j.issn.1672-6448.2024.03.010
淋巴瘤患者超声引导下颈内静脉置管术后静脉血栓形成的危险因素评估
Copy editor: 吴春凤
收稿日期: 2023-06-19
网络出版日期: 2024-06-05
版权
Risk factors for internal jugular venous thrombosis in patients with lymphoma after ultrasound-guided internal jugular vein catheterization
Received date: 2023-06-19
Online published: 2024-06-05
Copyright
探讨淋巴瘤患者在超声实时引导下行颈内静脉置管(IJVC)术后颈内静脉血栓形成的危险因素。
回顾性分析2021年2月至2023年3月于南京医科大学第一附属医院超声诊断科接受超声引导下IJVC的108例淋巴瘤患者的临床及超声资料。根据术前超声检查颈内静脉内是否有血栓形成分为无血栓组(62例)和血栓组(46例)。采用单因素分析(独立样本t检验、Mann-Whitney非参数检验和χ2检验)比较2组临床资料及超声特征的差异。应用多因素Logistic回归筛选血栓形成的独立危险因素。基于独立危险因素及高危因素构建血栓形成的风险预测模型。采用受试者操作特征(ROC)曲线的曲线下面积(AUC)评估风险预测模型和各独立危险因素的预测效能,最后使用列线图将风险模型可视化并通过校准曲线和临床决策曲线分析验证量化模型的应用价值。
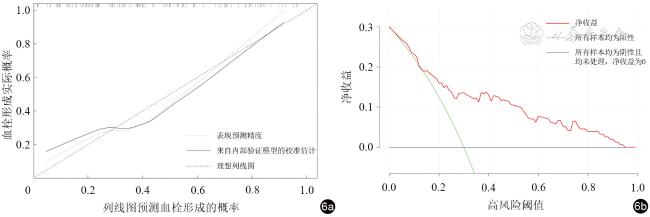
单因素分析结果表明,与无血栓组比较,血栓组使用14G导管管径比例(67.4% vs 30.6%)、使用单腔管比例(73.9% vs 46.8%)、纤维蛋白原(FIB)水平[(3.36±1.01)g/L vs(2.80±0.75)g/L]、D-二聚体水平[5.04(3.49,1.89)mg/L vs 0.18(0.10,0.58)mg/L]、侵袭性淋巴瘤比例(91.3% vs 75.8%)、糖尿病患者比例(93.5% vs 77.4%)更高,血管管径[10.6(7.8,14.1)mm vs 8.8(7.5,11.3)mm]更大,活化部分凝血活酶时间(APTT)[28.30(26.08,30.55)s vs 30.05(27.60,31.50)s]更短,差异均具有统计学意义(χ2=15.672,P=0.001;χ2=8.002,P=0.005;t=-3.328,P=0.001;Z=-3.483,P<0.001;χ2=4.375,P=0.036;χ2=5.135,P=0.023;Z=-2.262,P=0.024;Z=-2.206,P=0.027)。多因素回归分析显示血管管径(OR=1.175,95%CI:1.016~1.358,P=0.029)、FIB(OR=2.332,95%CI:1.185~4.590,P=0.014)、糖尿病(OR=4.904,95%CI:1.017~23.652,P=0.048)与淋巴瘤患者接受超声引导下IJVC后血栓形成独立相关。风险预测模型预测淋巴瘤患者血栓形成的AUC为0.831,敏感度为78.3%,特异度为72.6%,约登指数为0.509,较各独立危险因素具有更好的诊断效能。列线图模型在内部验证中预测血栓形成的风险表现出良好的拟合度。
血管管径、FIB、糖尿病是IJVC术后静脉血栓形成的独立危险因素。上述独立危险因素联合APTT、导管管径、D-二聚体、淋巴瘤生物学行为建立的风险预测模型结合淋巴瘤患者的一般情况,可在IJVC术前评估静脉血栓形成的风险,能为临床IJVC后颈内静脉血栓形成的预防及治疗提供指导。
曹琨芃 , 王昕玥 , 吴柳希 , 邓红艳 , 李璐 , 徐超丽 , 叶新华 . 淋巴瘤患者超声引导下颈内静脉置管术后静脉血栓形成的危险因素评估[J]. 中华医学超声杂志(电子版), 2024 , 21(03) : 310 -318 . DOI: 10.3877/cma.j.issn.1672-6448.2024.03.010
To identify risk factors for internal jugular venous thrombosis in patients with lymphoma after real-time ultrasound-guided internal jugular vein catheterization (IJVC) to provide guidance for its clinical prevention and treatment.
The clinical and ultrasonic data of 108 patients with lymphoma who received ultrasound-guided IJVC at The First Affiliated Hospital of Nanjing Medical University from February 2021 to March 2023 were collected. Based on whether there was thrombosis in the internal jugular vein assessed by vascular ultrasound before operation, the patients were divided into two groups: non-thrombotic group (n=62) and thrombus group (n=46). Differences in clinical and ultrasonic characteristics between the two groups were compared by univariate analysis. Independent risk factors were identified by multivariate logistic regression. A risk prediction model was constructed based on the identified independent risk factors and high-risk factors, and the predictive efficacy of the model and each independent risk factor was quantified by using the area under the receiver operating characteristic (ROC) curve (AUC). Finally, a nomogram was constructed based on multivariate logistic regression models to visualize the prediction model, and its prediction accuracy was evaluated using a calibration curve. Clinical effectiveness of the nomogram was evaluated by decision curve analysis.
Univariate analysis demonstrated that the proportion of patients using 14G catheter (67.4% vs 30.6%) and single lumen tube (73.9% vs 46.8%), the levels of fibrinogen (FIB) [(3.36±1.01) g/L vs (2.80±0.75) g/L] and D-dimer [5.04 (3.49, 1.89) mg/L vs 0.18 (0.10, 0.58) mg/L], and the proportion of patients with aggressive lymphoma (91.3% vs 75.8%) and diabetes (93.5% vs 77.4%) were significantly higher, vascular diameter [10.6 (7.8, 14.1) mm vs 8.8 (7.5, 11.3) mm] was significantly larger, and activated partial thromboplastin time (APTT) [28.30 (26.08, 30.55) s vs 30.05 (27.60, 31.50) s] was significantly shorter in the thrombus group than in the non-thrombotic group (χ2=15.672, P=0.001; χ2=8.002, P=0.005; t=-3.328, P=0.001; Z=-3.483, P<0.001; χ2=4.375, P=0.036; χ2=5.135, P=0.023; Z=-2.262, P=0.024; Z=-2.206, P=0.027). Multivariate regression analysis showed that vascular diameter (odds ratio [OR]=1.175, 95% confidence interval [CI]: 1.016-1.358, P=0.029), FIB (OR=2.332, 95%CI: 1.185-4.590, P=0.014), and diabetes (OR=4.904, 95%CI: 1.017-23.652, P=0.048) were independently associated with thrombosis in lymphoma patients after ultrasound-guided IJVC (P<0.05 for all). The risk prediction model had an AUC of 0.831, sensitivity of 78.3%, specificity of 72.6%, and Yoden index of 0.509, providing better diagnostic efficacy than each independent risk factor. The nomogram model showed good fit in internal validation for predicting the risk of thrombosis in patients with lymphoma after ultrasound-guided IJVC.
Vascular diameter, FIB, and diabetes are independent risk factors for venous thrombosis after IJVC. The risk model established based on the above independent risk factors combined with APTT, catheter diameter, DD2, and lymphoma biological behavior, together with the general condition of lymphoma patients, can predict the risk of venous thrombosis before IJVC surgery, and provide guidance for clinical prevention and treatment of thrombosis.
 表示,组间比较采用独立样本t检验;不符合正态分布者则以M(QR)表示,组间比较采用Mann-Whitney非参数检验。计数资料以例(%)表示,组间比较采用χ2检验,采用单因素分析比较血栓组和无血栓组2组患者临床资料和超声特征的差异,将单因素分析中P<0.05的因素纳入多因素回归分析,筛选出影响血栓形成的独立危险因素并构建风险预测模型。绘制不同独立危险因素和风险预测模型的受试者操作特征(receiver operating characteristic,ROC)曲线验证其诊断效能,计算曲线下面积(area under curve,AUC)、敏感度、特异度和约登指数。使用R4.2.2语言绘制列线图及校准曲线。以双侧检验P<0.05为差异有统计学意义。
表1 血栓组与非血栓组淋巴瘤患者临床特征比较 |
| 资料 | 血栓组(46例) | 无血栓组(62例) | 统计值 | P值 |
|---|---|---|---|---|
| 性别[例(%)] | χ2=0.500 | 0.823 | ||
| 男 | 24(52.2) | 31(50.0) | ||
| 女 | 22(47.8) | 31(50.0) | ||
| 年龄[岁,M(QR)] | 53.50(36.50,53.50) | 63.00(46.75,69.00) | Z=-1.638 | 0.101 |
| 导管管径[例(%)] | χ2=15.672 | 0.001 | ||
| 14G | 31(67.4) | 19(30.6) | ||
| 16G | 3(6.5) | 10(16.1) | ||
| 7F | 12(26.1) | 29(46.8) | ||
| 5F | 0(0) | 4(6.5) | ||
| 导管管腔数[例(%)] | χ2=8.002 | 0.005 | ||
| 单腔 | 34(73.9) | 29(46.8) | ||
| 双腔 | 12(26.1) | 33(53.2) | ||
| APTT[s,M(QR)] | 28.30(26.08,30.55) | 30.05(27.60,31.50) | Z=-2.206 | 0.027 |
FIB(g/L, ) ) | 3.36±1.01 | 2.80±0.75 | t=-3.328 | 0.001 |
| D-二聚体[mg/L,M(QR)] | 5.04(3.49,1.89) | 0.18(0.10,0.58) | Z=-3.483 | <0.001 |
| 白细胞计数[/L,M(QR)] | 0.53(0.25,1.18) | 0.17(0.10,0.57) | Z=-1.190 | 0.234 |
| 血小板计数[/L,M(QR)] | 183.00(108.25,251.75) | 183.00(144.25,212.50) | Z=-0.025 | 0.980 |
| 淋巴瘤分型[例(%)] | χ2=0.988 | 0.320 | ||
| HL | 5(10.9) | 11(17.7) | ||
| NHL | 41(89.1) | 51(82.3) | ||
| 淋巴瘤生物学行为[例(%)] | χ2=4.375 | 0.036 | ||
| 惰性 | 4(8.7) | 15(24.2) | ||
| 侵袭性 | 42(91.3) | 47(75.8) | ||
| 临床分期[例(%)] | χ2=0.597 | 0.440 | ||
| Ⅰ~Ⅱ期 | 15(32.6) | 16(25.8) | ||
| Ⅲ~Ⅳ期 | 31(67.4) | 46(74.2) | ||
| 临床分组[例(%)] | χ2=1.081 | 0.298 | ||
| A组 | 34(73.9) | 40(64.5) | ||
| B组 | 12(26.1) | 22(35.5) | ||
| 糖尿病[例(%)] | χ2=5.135 | 0.023 | ||
| 有 | 43(93.5) | 48(77.4) | ||
| 无 | 3(6.5) | 14(22.6) | ||
| 高血压[例(%)] | χ2=0.597 | 0.440 | ||
| 有 | 11(23.9) | 19(30.6) | ||
| 无 | 35(76.1) | 43(69.4) | ||
| 冠心病[例(%)] | χ2=1.400 | 0.237 | ||
| 有 | 5(10.9) | 3(4.8) | ||
| 无 | 41(89.1) | 59(95.2) |
注:APTT为活化部分凝血活酶时间,FIB为纤维蛋白原;HL为霍奇金淋巴瘤,NHL为非霍奇金淋巴瘤;临床分期根据Ann Arbor分期;临床分组:B组患者有全身症状,表现为不明原因发热>38 ℃、盗汗及半年内体质量下降10%以上,A组患者无以上3种症状 |
表2 血栓组与非血栓组的淋巴瘤患者超声特征比较[M(QR)] |
| 组别 | 例数 | 血管管径(mm) | 血流流速(cm/s) |
|---|---|---|---|
| 血栓组 | 46 | 10.6(7.8,14.1) | 39.4(23.2,60.5) |
| 无血栓组 | 62 | 8.8(7.5,11.3) | 31.5(22.9,52.3) |
| Z值 | -2.262 | -0.616 | |
| P值 | 0.024 | 0.538 |
表3 接受超声引导下中心静脉置管术的淋巴瘤患者血栓形成因素的多因素回归分析 |
| 项目 | 回归系数 | 标准误 | OR值(95%CI) | P值 |
|---|---|---|---|---|
| 血管管径 | 0.161 | 0.074 | 1.175(1.016~1.358) | 0.029 |
| 14G导管 | 0.730 | 0.522 | 2.076(0.747~5.770) | 0.161 |
| 16G导管 | -1.142 | 0.917 | 0.319(0.053~1.927) | 0.213 |
| 5F导管 | -21.066 | 18 275.846 | 0.000(0.000~lnf) | 0.999 |
| APTT | -0.102 | 0.071 | 0.903(0.786~1.038) | 0.152 |
| FIB | 0.847 | 0.345 | 2.332(1.185~4.590) | 0.014 |
| D-二聚体 | 0.255 | 0.214 | 1.290(0.848~1.963) | 0.234 |
| 侵袭性淋巴瘤 | 1.264 | 0.763 | 3.539(0.794~15.779) | 0.097 |
| 有糖尿病 | 1.590 | 0.803 | 4.904(1.017~23.652) | 0.048 |
| 常量 | -4.399 | 2.445 | - | 0.072 |
注:APTT为活化部分凝血活酶时间,FIB为纤维蛋白原;各因素赋值为导管管径(7F=0,14G=1,16G=2,5F=3);淋巴瘤生物学行为(惰性=0,侵袭性=1);糖尿病(无=0,有=1);血管管径、APTT、FIB、D-二聚体均为计量数据 |
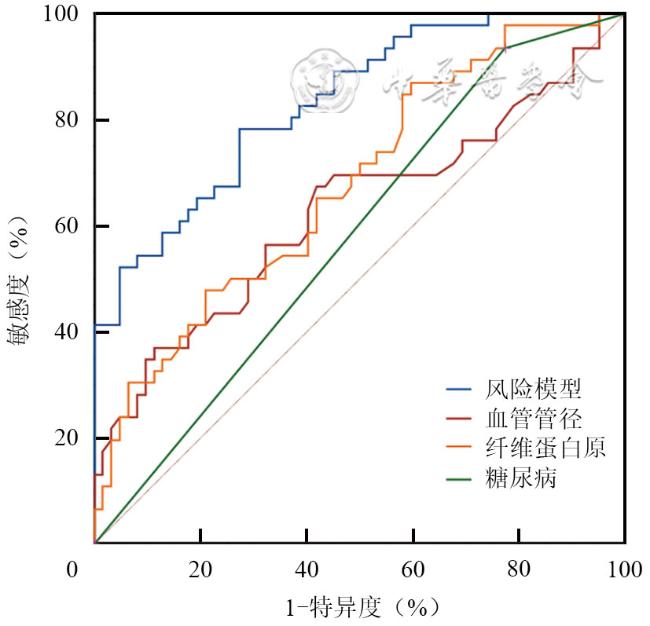
表4 风险模型与各独立危险因素预测淋巴瘤患者血栓形成的预测效能 |
| 特征 | 曲线下面积 | 敏感度(%) | 特异度(%) | 约登指数 | 标准误差 | 95%CI |
|---|---|---|---|---|---|---|
| 风险预测模型 | 0.831 | 78.3 | 72.6 | 0.509 | 0.038 | 0.756~0.906 |
| 血管管径 | 0.628 | 37.0 | 88.7 | 0.257 | 0.057 | 0.517~0.738 |
| 纤维蛋白原 | 0.676 | 87.0 | 40.3 | 0.273 | 0.052 | 0.575~0.777 |
| 糖尿病 | 0.580 | 93.5 | 22.6 | 0.161 | 0.055 | 0.473~0.688 |
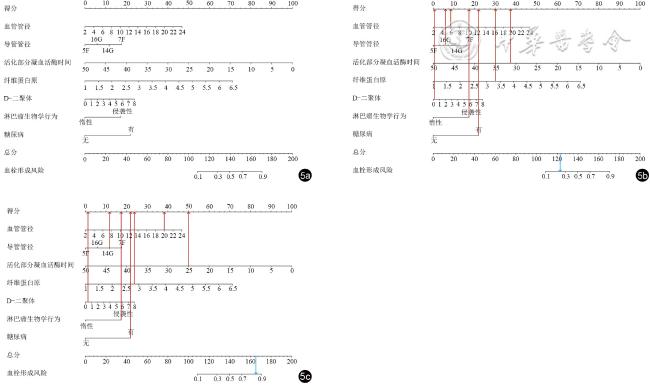
图5 预测超声引导下颈内静脉置管(IJVC)术后淋巴瘤患者血栓形成风险的列线图模型。每例患者根据其自身情况计算每个变量对应的得分,其总分为对应患者出现血栓的概率(图a)。图b:例1,血管管径6.0 mm,使用16G导管,活化部分凝血活酶时间31.3 s,纤维蛋白原3.3 g/L,D-二聚体0.28 mg/L,侵袭性淋巴瘤,有糖尿病病史,根据列线图计算每一项得分后(红色箭头所指),总分约122.75分,形成血栓风险约25%(蓝色箭头所指),后续随访过程中患者IJVC后未形成颈内静脉血栓。图c:例2,血管管径20.0 mm,使用14G导管,活化部分凝血活酶时间25.0 s,纤维蛋白原2.79 g/L,D-二聚体0.4 mg/L,侵袭性淋巴瘤,有糖尿病病史,根据列线图计算每一项得分后(红色箭头所指),总分约165.75分,形成血栓风险约86%(蓝色箭头所指),后续随访过程中患者IJVC术后形成颈内静脉血栓 |
| 1 |
吴永勇, 谢俊英, 杨林, 等. 3500例肿瘤患者中心静脉置管相关并发症及危险因素分析 [J]. 癌症进展, 2018, 16(10): 1245-1249.
|
| 2 |
|
| 3 |
|
| 4 |
|
| 5 |
|
| 6 |
|
| 7 |
|
| 8 |
|
| 9 |
|
| 10 |
|
| 11 |
杨婧诗, 邹立群. 淋巴瘤相关静脉血栓的影响因素及风险评估模型的研究进展 [J]. 中国全科医学, 2021, 24(23): 2992-2997.
|
| 12 |
|
| 13 |
|
| 14 |
|
| 15 |
|
| 16 |
中华人民共和国国家卫生健康委员会. 淋巴瘤诊疗指南(2022年版) [J]. 中国肿瘤临床与康复, 2023, 30(3): 135-158.
|
| 17 |
|
| 18 |
顾婕, 钱火红, 任凭, 等. 2021年美国输液护理学会《输液治疗实践标准》中血管通路装置的置入与维护解读 [J]. 护理研究, 2023, 37(3): 377-381.
|
| 19 |
袁晓丰. 恶性肿瘤化疗不同深静脉置管方式与静脉血栓形成的原因分析 [J]. 护理实践与研究, 2015, 12(1): 68.
|
| 20 |
|
| 21 |
曲瑞泽, 张志鹏, 付卫. 肿瘤患者中心静脉导管相关血栓的成因和诊治研究进展 [J]. 中国微创外科杂志, 2022, 22(3): 246-250.
|
| 22 |
刘霞, 张锟. 超声引导下中心静脉置管在危重症患者的临床应用 [J]. 临床医药文献电子杂志, 2020, 7(15): 25-26.
|
| 23 |
李聪, 徐忠良. 颈静脉的超声检测技术在临床中的应用价值 [J]. 中风与神经疾病杂志, 2021, 38(11): 1054-1056.
|
| 24 |
|
| 25 |
|
| 26 |
岑晨, 张苏展. 肿瘤相关静脉血栓栓塞症风险评估及一级预防的研究进展 [J]. 实用肿瘤杂志, 2021, 36(4): 379-386.
|
| 27 |
傅爱林, 沈刚, 汪小葛, 等. 恶性淋巴瘤合并静脉血栓栓塞的临床特征及血液学指标检测 [J]. 中国肿瘤临床, 2015, 42(4): 226-230.
|
| 28 |
|
| 29 |
|
| 30 |
|
| 31 |
|
| 32 |
|
| 33 |
|
| 34 |
盘德辉, 李翠君, 姚剑坤, 等. 血糖控制水平对2型糖尿病合并冠心病病人血液高凝状态及血栓栓塞事件的影响 [J]. 中西医结合心脑血管病杂志, 2020, 18(13): 2097-2100.
|
| 35 |
付春玲, 刘红英, 郭英, 等. 基于静脉血栓栓塞症风险评分的综合措施干预高龄2型糖尿病住院患者静脉血栓的发生 [J]. 上海预防医学, 2023, 35(4): 320-325.
|
/
| 〈 |
|
〉 |