
2024 , Vol. 21 >Issue 06: 563 - 570
DOI: https://doi.org/10.3877/cma.j.issn.1672-6448.2024.06.003
基于深度学习的乳腺超声应变弹性图像生成模型的应用研究
Copy editor: 汪荣
收稿日期: 2024-03-18
网络出版日期: 2024-08-05
基金资助
国家自然科学基金面上项目(82071934)
陕西省科技计划项目国合重点项目(2020KWZ-022)
陕西省高等教育教学改革研究重点项目(21JZ009)
空军军医大学临床研究项目(2021LC2210)
版权
Application value of a deep learning-based model for generating strain elastography images using breast grayscale ultrasound images
Received date: 2024-03-18
Online published: 2024-08-05
Copyright
探讨基于深度学习模型生成乳腺超声应变弹性图像的应用价值。
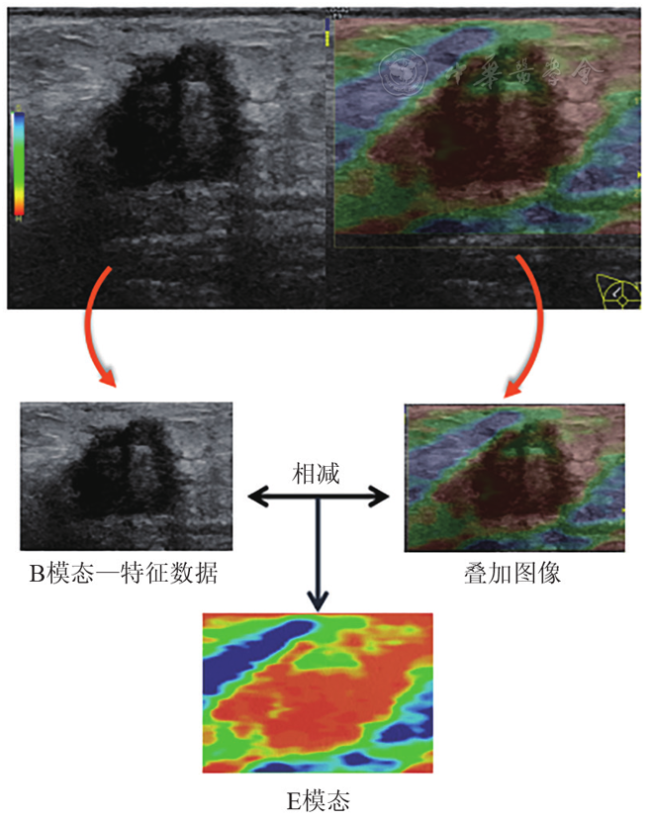
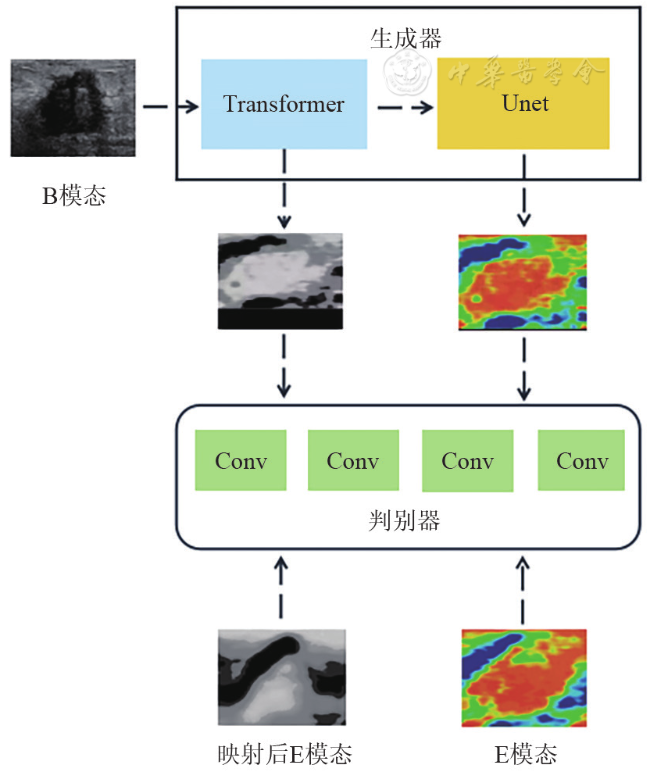
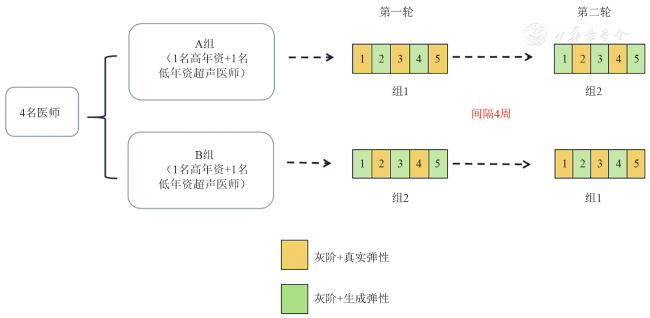
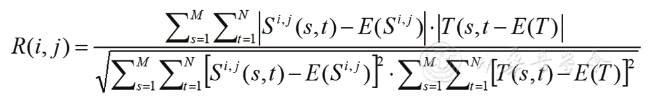
回顾性收集2019年5月至2022年6月在西京医院行乳腺超声检查的患者的超声图像共1336组,在神经网络中生成对抗网络(GAN)的基础上构建深度学习生成模型,使用训练集882组和验证集354组图像进行模型的训练和调整,另外100组测试集图像使用模型生成弹性图像,比较真实弹性图像和生成弹性图像的相似度。选取4位不同年资医师(高低年资医师各2名)比较两种弹性图像的差异。应用归一化互相关(NCC)值评价两种弹性图像的相似程度,并进行阅片医师真实性评分;基于Tsukuba 5分弹性评分标准,应用Kappa检验比较4位医师弹性评分的一致性,绘制ROC曲线评估不同医师分别结合两种弹性图像应用BI-RADS分类诊断乳腺病灶良恶性的效能。
测试集中两种弹性图像相似度的NCC平均值为0.70±0.08,中位数0.70,范围0.50~0.86。真实性评价所有医师得分为0.49,低年资医师得分0.45,高年资医师得分0.53,均接近0.50。比较4位医师弹性评分的一致性Kappa值,生成图像高于真实图像(Kappa值:0.61 vs 0.57)。每位医师分别结合两种弹性图像应用BI-RADS分类的ROC曲线下面积差异无统计学意义(P>0.05),除1名高年资医师的特异度(P=0.0196)和阳性预测值(P=0.021)外,所有医师的敏感度、特异度、阳性预测值、阴性预测值结果差异均无统计学意义(P均>0.05)。
基于深度学习构建的乳腺超声应变弹性图像生成模型,能够生成与真实弹性图像相似的弹性图像,并且生成图像在辅助诊断方面达到了与真实图像相近的临床价值。
李洋 , 蔡金玉 , 党晓智 , 常婉英 , 巨艳 , 高毅 , 宋宏萍 . 基于深度学习的乳腺超声应变弹性图像生成模型的应用研究[J]. 中华医学超声杂志(电子版), 2024 , 21(06) : 563 -570 . DOI: 10.3877/cma.j.issn.1672-6448.2024.06.003
To explore the application value of a deep learning-based model for generating strain elastography images using breast grayscale ultrasound images.
A total of 1336 sets of ultrasound images of patients who underwent breast ultrasound examination at Xijing Hospital from May 2019 to June 2022 were retrospectively collected. A deep learning-based model for generating strain elastography images was constructed on the basis of generative adversarial network (GAN) in neural network. Then, 882 sets of images from the training set and 354 sets of images from the validation set were used to train and adjust the model, and 100 sets of images from the test set were additionally used to generate strain elastography images. The similarity was compared between the real elastography images and the generated elastography images. Four physicians of different seniority (2 senior and 2 junior) were selected to compare the differences between the two kinds of elastography images. Normalized cross-correlation (NCC) values were used to evaluate the similarity of the two kinds of elastography images and the authenticity score of reading physicians was obtained. Based on the Tsukuba's 5-point elastography scoring scale, Kappa test was applied to test the consistency of elastography scores of the four physicians. Receiver operating characteristic (ROC) curves were plotted to evaluate the performance of breast imaging reporting and data system (BI-RADS) classification in the diagnosis of benign and malignant breast lesions by different physicians based on the two kinds of elastography images.
The average NCC value for the similarity of the two kinds of elastography images in the test set was (0.70±0.08), with a median of 0.70 (range: 0.50 to 0.86). The average authenticity score of all the physicians was 0.49, with an average score of 0.45 for junior doctors and 0.53 for senior doctors, all of which were close to 0.50. The Kappa value of elastography scores of the four physicians was higher in the generated elastography image group than in the real elastography image group (Kappa values: 0.61 vs 0.57). There was no statistically significant difference in the area under ROC curve for each physician applying BI-RADS classification based on the two kinds of elastography images (P>0.05). Except for the specificity (P=0.0196) and positive predictive value (P=0.021) of one senior physician, there were no statistically significant differences in sensitivity, specificity, positive predictive value, or negative predictive value among other physicians (P>0.05).
The constructed deep learning-based model for generating strain elastography images using breast grayscale ultrasound images can generate elastography images similar to real elastography images, and the generated elastography images is comparable to real elastography in terms of diagnostic assistance.
 ±s表示,以病理结果为金标准,绘制BI-RADS分类诊断病灶良恶性的ROC曲线并计算ROC曲线下面积(area under the curve,AUC),通过诊断敏感度、特异度、阳性预测值、阴性预测值、AUC值来比较每位阅片医师分别结合两种弹性图像进行BI-RADS分类的诊断效能,率的比较采用McNemar检验,AUC值的比较采用DeLong检验。阅片医师对两种弹性图像评分的一致性使用Kappa检验,Kappa值≤0.20表示一致性极低,0.21~0.40表示一致性一般,0.41~0.60表示一致性中等,0.61~0.80表示一致性良好,Kappa值≥0.8表示一致性高。以P<0.05为差异有统计学意义。
表1 图像一般特征和病灶病理结果 |
| 特征 | 训练集 | 验证集 | 测试集 |
|---|---|---|---|
| 病例(例) | 384 | 196 | 100 |
年龄(岁, ±s) ±s) | 45.10±11.48 | 47.19±10.14 | 46.20±9.50 |
| 图像(组) | 882 | 354 | 100 |
| 良性 | 420 | 161 | 60 |
| 恶性 | 462 | 193 | 40 |
表2 每位医师分别结合两种弹性图像应用BI-RADS分类诊断病灶良恶性的AUC值比较 |
| 医师 | 真实图像的AUC | 生成图像的AUC | Z值 | P值 |
|---|---|---|---|---|
| 低年资医师1 | 0.62 | 0.74 | 1.756 | 0.0790 |
| 低年资医师2 | 0.75 | 0.76 | 0.262 | 0.7934 |
| 高年资医师1 | 0.78 | 0.76 | 0.455 | 0.6488 |
| 高年资医师2 | 0.80 | 0.75 | 1.411 | 0.1583 |
注:AUC为ROC曲线下面积;BI-RADS为乳腺影像报告和数据系统 |
表3 每位医师分别结合两种弹性图像应用BI-RADS分类的诊断效能比较(%) |
| 医师 | 敏感度 | 特异度 | 阳性预测值 | 阴性预测值 | ||||||||
|---|---|---|---|---|---|---|---|---|---|---|---|---|
| 真实图像 | 生成图像 | P值 | 真实图像 | 生成图像 | P值 | 真实图像 | 生成图像 | P值 | 真实图像 | 生成图像 | P值 | |
| 低年资医师1 | 90.00 | 95.00 | 0.4142 | 18.22 | 28.33 | 0.2008 | 42.35 | 46.91 | 0.1318 | 73.33 | 89.47 | 0.2470 |
| 低年资医师2 | 97.50 | 97.50 | 1.0000 | 36.67 | 33.33 | 0.5637 | 50.65 | 49.37 | 0.5930 | 95.65 | 95.24 | 0.9467 |
| 高年资医师1 | 85.00 | 82.50 | 0.6547 | 46.67 | 50.00 | 0.6831 | 51.52 | 52.38 | 0.8397 | 82.35 | 81.08 | 0.8240 |
| 高年资医师2 | 92.50 | 90.00 | 0.5637 | 48.33 | 36.66 | 0.0196 | 54.41 | 48.65 | 0.0210 | 90.63 | 84.62 | 0.3047 |
| 1 |
|
| 2 |
沈松杰, 孙强, 黄欣, 等. 中国女性乳腺癌筛查指南(2022年版)[J]. 中国研究型医院, 2022, 9(2): 6-13.
|
| 3 |
|
| 4 |
|
| 5 |
|
| 6 |
American College of Radiology. Breast Imaging Reporting and Data System(BI-RADS). Ultrasound [M]. 5th ed. Reston, VA: American College of Radiology, 2013: 221-362.
|
| 7 |
朱庆莉, 姜玉新. 乳腺影像报告与数据系统指南(第5版)超声内容更新介绍[J/CD]. 中华医学超声杂志(电子版), 2016, 13(1): 5-7.
|
| 8 |
|
| 9 |
|
| 10 |
|
| 11 |
|
| 12 |
|
| 13 |
|
| 14 |
|
/
| 〈 |
|
〉 |