
2024 , Vol. 21 >Issue 08: 802 - 808
DOI: https://doi.org/10.3877/cma.j.issn.1672-6448.2024.08.009
超声造影评估类风湿关节炎亚临床滑膜炎疾病进展的价值
Copy editor: 汪荣
收稿日期: 2023-12-25
网络出版日期: 2024-09-11
基金资助
内蒙古自治区科学基金(2023QN08006)
内蒙古自治区专项科技发展项目(2023SGGZ052)
内蒙古医科大学附属医院院级项目(2023NYFYTS014)
版权
Value of contrast-enhanced ultrasound in assessing progression of subclinical synovitis in patients with rheumatoid arthritis
Received date: 2023-12-25
Online published: 2024-09-11
Copyright
应用超声造影(CEUS)对类风湿关节炎(RA)亚临床滑膜炎进行血流定量评估,探讨CEUS相关参数评估RA亚临床滑膜炎疾病进展的价值。
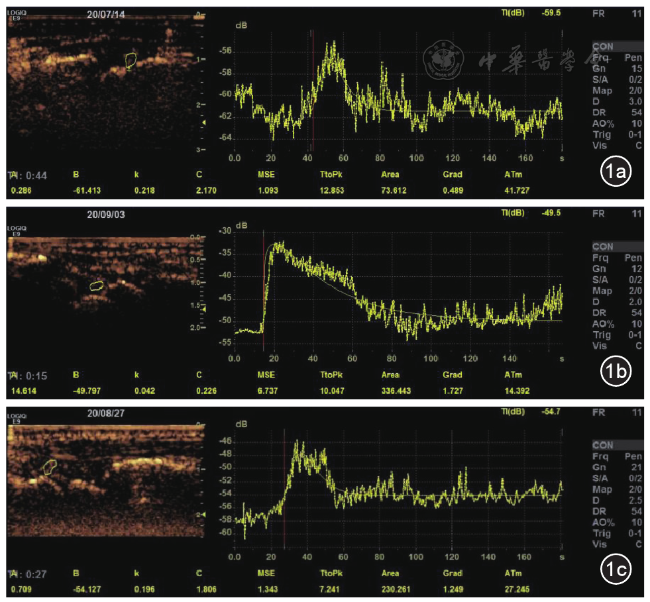
收集2019年10月至2023年12月就诊于内蒙古医科大学附属医院的RA亚临床滑膜炎患者87例。纳入患者进行腕关节CEUS检查,获取造影定量参数:开始显影时间(AT)、达峰时间(TTP)、峰值强度(PI)、Gard梯度及时间-强度(TIC)曲线下面积,并对滑膜血流情况进行分级;治疗3、6、12个月后对患者进行随访。将CEUS定量指标与28关节活动度评分(DAS 28)进行相关性分析,以DAS 28评分作为判断RA亚临床滑膜炎是否加重的标准,将患者分为加重组33例与非加重组54例,应用单因素及多因素Logistic回归分析筛选RA亚临床滑膜炎加重的独立危险因素,并绘制ROC曲线分析相关参数的预测效能。
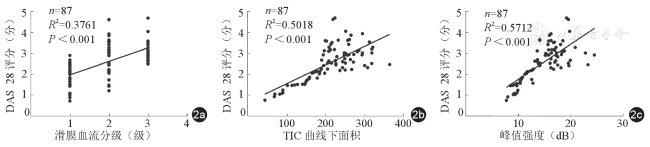
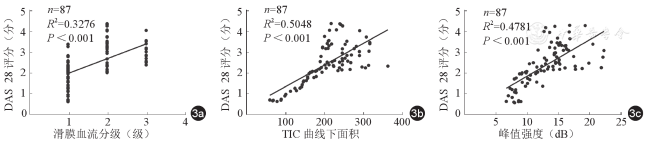
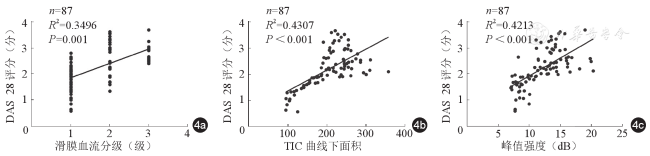
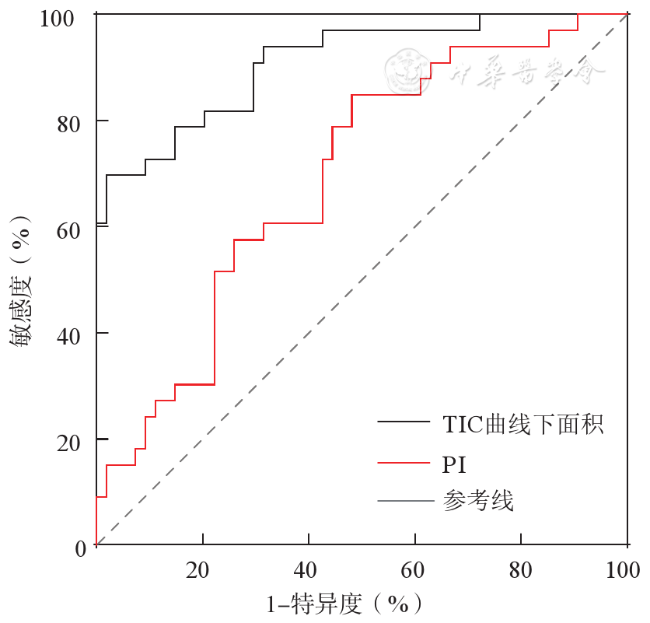
87例患者中,滑膜血流分级1级36例、2级29例、3级22例。治疗后3个月滑膜血流分级、TIC曲线下面积、PI与DAS 28评分存在显著正相关(r为0.659、0.711、0.777,P<0.05)。治疗后6个月滑膜血流分级、TIC曲线下面积、PI与DAS 28评分存在显著正相关(r为0.651、0.707、0.757,P<0.05)。治疗后12个月滑膜血流分级、TIC曲线下面积、PI与DAS 28评分存在显著正相关(r为0.640、0.688、0.721,P<0.05)。多因素Logistic回归分析结果表明,TIC曲线下面积(OR=1.023,95% CI:1.003~1.047)、PI(OR=1.564,95% CI:1.031~2.267)是RA亚临床滑膜炎疾病加重的独立危险因素。二者预测疾病是否加重的ROC曲线下面积分别为0.909、0.692,差异有统计学意义(P<0.05)。
CEUS定量指标与DAS 28评分具有较好的相关性,TIC曲线下面积、PI对于预测RA亚临床滑膜炎疾病进展具有良好的应用价值,可以为临床治疗方案的制定、疗效评估及病情监测提供客观依据。
王博冉 , 乔春梅 , 李春歌 , 王欣 , 王晓磊 . 超声造影评估类风湿关节炎亚临床滑膜炎疾病进展的价值[J]. 中华医学超声杂志(电子版), 2024 , 21(08) : 802 -808 . DOI: 10.3877/cma.j.issn.1672-6448.2024.08.009
To evaluate the synovial blood flow in rheumatoid arthritis (RA) patients with subclinical synovitis by contrast-enhanced ultrasound (CEUS), and to evaluate the value of CEUS-related parameters in evaluating the progression of subclinical synovitis in these patients.
A total of 87 patients with RA and subclinical synovitis admitted to the Affiliated Hospital of Inner Mongolia Medical University from October 2019 to December 2023 were collected. The patients were included for wrist CEUS examination, and quantitative parameters of CEUS were obtained: arrival time (AT), time to peak (TTP), peak intensity (PI), Gard gradient, and area under the time-intensity curve (TIC). The synovial blood flow was graded. Patients were followed up at 3, 6, and 12 months after treatment. Correlation analysis was conducted between the quantitative indexes of CEUS and the Disease Activity Score (DAS) 28, and the DAS28 was used as the criterion to judge whether the disease was aggravated. The patients were divided into 33 cases with disease exacerbation and 54 without. Univariate and multivariate Logistic regression analyses were performed to identify the independent risk factors for predicting the exacerbation of subclinical synovitis in RA, and receiver operating characteristic (ROC) curve analysis was performed to evaluate the predictive efficacy of related parameters for the exacerbation of subclinical synovitis.
Among the 87 patients included, 36 had grade 1 synovial blood flow, 29 had grade 2, and 22 had grade 3. Synovial blood flow grade, area under the TIC, and PI had a significant correlation with DAS28 at 3 months (r = 0.659, 0.711, 0.777, P<0.05), 6 months (r = 0.651, 0.707, and 0.757, respectively, P<0.05) and 12 months (r = 0.640, 0.688, and 0.721, respectively, P<0.05) after treatment. Multivariate Logistic regression analysis showed that the area under the TIC (odds ratio [OR]=1.023, 95% confidence interval [CI]: 1.003~1.047) and PI (OR = 1.564, 95%CI: 1.031~2.267) were independent risk factors for predicting the exacerbation of subclinical synovitis in patients with RA. The area under the ROC curve values of the area under the TIC and PI for predicting disease exacerbation were 0.909 and 0.692, respectively, and their difference was statistically significant (P<0.05).
There is a good correlation between CEUS quantitative indexes and DAS28, and the area under the TIC and PI have good application value in predicting the progression of subclinical synovitis in RA patients, which can provide an objective basis for the formulation of clinical treatment plan, efficacy evaluation, and disease monitoring.
 ±s表示,2组间比较采用独立样本t检验;非正态分布的计量资料以M(P25,P75)表示,2组间比较采用非参数秩和检验。相关性采用Spearman相关分析法。采用二元Logistic回归分析RA亚临床滑膜炎加重的独立危险因素,并绘制ROC曲线进行效能分析。P<0.05表示差异具有统计学意义。
表1 RA亚临床滑膜炎加重组与非加重组的滑膜血流分级及造影定量参数比较 |
| 参数 | RA亚临床滑膜炎非加重组(n=54) | RA亚临床滑膜炎加重组(n=33) | 统计值 | P值 |
|---|---|---|---|---|
| 滑膜血流分级[例(%)] | Z=6.686 | <0.001 | ||
| 1级 | 35(64.8) | 1(3.0) | ||
| 2级 | 15(27.8) | 14(42.4) | ||
| 3级 | 4(7.4) | 18(54.6) | ||
| 达峰时间[s,M(P25,P75)] | 17.81(14.66,20.51) | 10.68(8.20,18.24) | Z=2.616 | 0.009 |
TIC曲线下面积( ±s) ±s) | 137.46±67.87 | 288.57±69.68 | t=6.185 | <0.001 |
| Grad梯度[M(P25,P75)] | 1.19(0.47,1.42) | 1.15(0.66,1.84) | Z=0.848 | 0.397 |
| 开始显影时间[s,M(P25,P75)] | 26.42(24.46,28.50) | 25.03(24.31,28.08) | Z=0.608 | 0.543 |
| 峰值强度[M(P25,P75)] | 9.65(8.60,12.10) | 18.20(15.35,23.25) | Z=4.491 | <0.001 |
注:TIC为时间-强度曲线;RA为类风湿关节炎 |
表2 滑膜血流分级及造影定量参数预测RA亚临床滑膜炎是否加重的多因素Logistic回归分析 |
| 因素 | 偏回归系数 | 标准误差 | Wald χ2值 | P值 | OR值 | 95%CI |
|---|---|---|---|---|---|---|
| TIC曲线下面积 | 0.026 | 0.013 | 4.090 | 0.043 | 1.023 | 1.003~1.047 |
| 峰值强度 | 0.446 | 0.218 | 4.185 | 0.041 | 1.564 | 1.031~2.267 |
注:TIC为时间-强度曲线;RA为类风湿关节炎 |
| 1 |
|
| 2 |
|
| 3 |
|
| 4 |
|
| 5 |
|
| 6 |
|
| 7 |
|
| 8 |
王妍华, 罗静, 冯秀媛, 等. 临床缓解类风湿关节炎患者亚临床滑膜炎的评估及特征分析[J]. 西安交通大学学报(医学版), 2021, 42(1): 93-98.
|
| 9 |
|
| 10 |
|
| 11 |
|
| 12 |
蔡晓峰, 查月琴, 董凤林, 等. 超声对类风湿关节炎掌指关节与近端指间关节病变的评估价值[C]. 中国超声医学工程学会第六届肌肉骨骼超声医学学术会议论文集. 2017: 24-25.
|
| 13 |
韩彬, 刘玉婷. 超声造影与彩色多普勒超声在类风湿关节炎治疗前后的应用[J]. 中国药物与临床, 2019, 19(9): 1414-1417.
|
| 14 |
|
| 15 |
中华医学会风湿病学分会. 类风湿关节炎诊断及治疗指南[J]. 中华风湿病学杂志, 2010, 14(4): 265-270.
|
| 16 |
|
| 17 |
|
| 18 |
秦晨曼. 基于C-反应蛋白和血沉的类风湿关节炎患者疾病活动度DAS 28的比较[D]. 郑州: 郑州大学, 2013.
|
| 19 |
|
| 20 |
|
| 21 |
|
| 22 |
|
| 23 |
甄俊平, 王峻, 柳澄, 等. 类风湿关节炎早期滑膜病变的MR诊断[J]. 实用放射学杂志, 2008, 24(1): 65-69.
|
| 24 |
|
| 25 |
赵绵松, 夏蓉晖, 王玉华, 等. 骨关节炎与类风湿关节炎患者膝关节滑膜中血管内皮生长因子及血管形态的特征[J]. 北京大学学报(医学版), 2012, 44(6): 927-931.
|
| 26 |
杨琛, 彭婵娟. 超声造影定量评价体系及其影响因素分析[J]. 中国肿瘤, 2016, 25(3): 212-218.
|
| 27 |
郭津含, 万浩强, 邹小停, 等. 滑膜血管新生在类风湿关节炎早期诊断及治疗中的应用[J]. 现代医用影像学, 2018, 27(7): 2249-2251.
|
| 28 |
|
/
| 〈 |
|
〉 |