
2024 , Vol. 21 >Issue 12: 1103 - 1110
DOI: https://doi.org/10.3877/cma.j.issn.1672-6448.2024.12.002
基于超声的瘤内联合瘤周影像组学模型对乳腺癌HER2 表达状态的预测价值
Copy editor: 汪荣
收稿日期: 2024-11-02
网络出版日期: 2025-01-23
基金资助
四川省区域联合创新重点项目(2024YFHZ0078)国家自然科学基金面上项目(81971636)四川省科技厅青年基金项目(2024NSFSC1781)四川省卫健委科技项目(临床研究专项 23LCYJ039)
版权
Ultrasound-based intratumoral and peritumoral radiomics for predicting HER2 status in patients with breast cancer
Received date: 2024-11-02
Online published: 2025-01-23
Copyright
目的
探讨瘤内及瘤周超声影像组学特征对于乳腺癌患者人表皮生长因子受体2(HER2)表达状态的预测价值。
方法
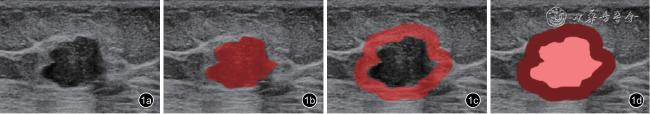
回顾性分析2021 年4 月至2024 年3 月于成都市第三人民医院确诊为乳腺癌的403 例患者的资料,将403 例患者随机划分为训练集282 例和验证集121 例。在常规超声显示肿瘤最大长轴切面勾画获得瘤内感兴趣区,沿肿瘤边界向外扩张3 mm 得到瘤周感兴趣区,从上述感兴趣区中分别提取影像组学特征,在训练集中通过Mann-Whitney U 检验、Pearson 相关分析及最小绝对收缩与选择算子进行特征降维,使用支持向量机作为分类器构建影像组学模型,并计算影像组学评分;采用单因素及多因素分析比较HER2 阳性组和阴性组之间的临床病理指标,筛选出临床独立危险因素,构建临床模型;将影像组学评分与临床独立危险因素共同纳入多因素Logistic 回归,构建联合模型。通过ROC 曲线、校准曲线及决策曲线对模型性能和临床应用价值进行评估。
结果
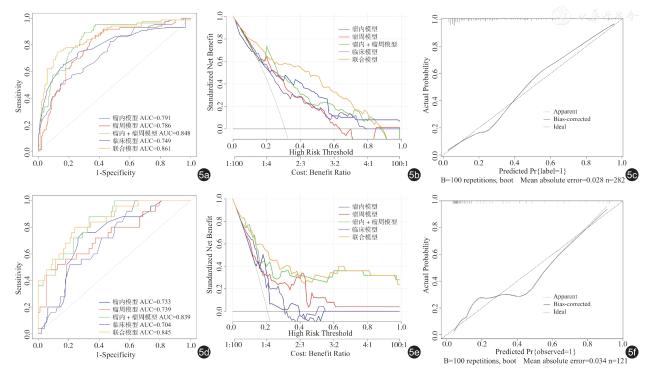
瘤内模型、瘤周模型、瘤内+瘤周模型、临床模型和联合模型在训练集的ROC 曲线下面积(AUC)分别为0.791、0.786、0.848、0.749、0.861,在验证集的AUC 分别为0.733、0.739、0.839、0.704、0.845。决策曲线分析结果显示,联合模型具有最高的临床应用价值,校准曲线显示联合模型未偏离理想曲线,Hosmer-Lemeshow 检验结果显示联合模型拟合度较好(P=0.209)。
结论
综合考虑乳腺癌瘤内及瘤周的超声影像组学模型可在术前无创预测乳腺癌患者HER2 表达状态,结合临床独立危险因素的联合模型预测效能更高,具有临床应用价值。
关键词: 超声; 影像组学; 乳腺癌; 人表皮生长因子受体2
聂全禹 , 李明星 , 刘莹 , 王慧 , 陈媛媛 , 周鸿 , 周洋 . 基于超声的瘤内联合瘤周影像组学模型对乳腺癌HER2 表达状态的预测价值[J]. 中华医学超声杂志(电子版), 2024 , 21(12) : 1103 -1110 . DOI: 10.3877/cma.j.issn.1672-6448.2024.12.002
Objective
To evaluate the predictive value of intratumoral and peritumoral ultrasound imaging features for human epidermal growth factor receptor 2 (HER2) expression status in breast cancer patients.
Methods
A retrospective analysis was conducted on data from 403 breast cancer patients diagnosed at the Third People's Hospital of Chengdu between April 2021 and March 2024.The patients were randomly divided into a training set of 282 patients and a validation set of 121 patients.For conventional ultrasound, the maximum longitudinal axis of the tumor was used to delineate the intratumoral region of interest (ROI).A 3 mm extension outward from the tumor boundary was used to define the peritumoral ROI.Radiomics features were extracted from these ROIs.In the training set, features were reduced using the Mann-Whitney U test, Pearson correlation analysis,and the Least Absolute Shrinkage and Selection Operator (LASSO).A support vector machine (SVM) classifier was used to construct a radiomics model and calculate the radiomics score.Univariate and multivariate analyses were used to compare clinical pathological indicators between HER2-positive and HER2-negative groups to identify independent clinical risk factors and construct a clinical model.Radiomics scores and independent clinical risk factors were combined into a multivariate logistic regression model to create a combined model.The performance and clinical utility of the models were evaluated using ROC curve, calibration curve, and decision curve analyses.
Results
The area under the curve (AUC) values for the intratumoral model, peritumoral model, combined intratumoral and peritumoral model, clinical model, and combined model in the training set were 0.791, 0.786, 0.848,0.749, and 0.861, respectively.In the validation set, the corresponding AUC values were 0.733, 0.739, 0.839, 0.704,and 0.845, respectively.Decision curve analysis showed that the combined model had the highest clinical utility,and the calibration curve indicated that the combined model was close to the ideal curve.The Hosmer-Lemeshow test showed good goodness of fit for the combined model (P=0.209).
Conclusion
The ultrasound radiomics models considering both intratumoral and peritumoral features can non-invasively predict HER2 expression status in breast cancer patients before surgery.The combined model, which incorporates independent clinical risk factors,demonstrates higher predictive efficacy and has clinical application value.
 ±s 表示,采用t 检验或Mann-Whitney U 检验分析计量资料的组间差异;计数资料以例(%)表示,采用χ2 检验或Fisher 精确检验评估计数资料的组间差异。通过ROC 曲线、校准曲线及决策曲线对模型性能和临床应用价值进行评估。P<0.05 被认为具有统计学意义。
表1 训练集与验证集基线资料比较[例(%)] |
| 资料 | 训练集(282例) | 验证集(121例) | 统计值 | P值 |
|---|---|---|---|---|
| 年龄(岁,±s) | 55.32±12.94 | 54.88±13.40 | t=0.305 | 0.761 |
| 肿瘤最大直径(cm,±s) | 2.32±1.04 | 2.41±0.95 | t=0.808 | 0.420 |
| BMI值 | χ 2=0.495 | 0.482 | ||
| ≥24(kg/m2) | 172(60.99) | 79(65.29) | ||
| <24(kg/m2) | 110(39.01) | 42(34.71) | ||
| 是否绝经 | χ 2=0.345 | 0.557 | ||
| 是 | 200(70.92) | 90(74.38) | ||
| 否 | 82(29.08) | 31(25.62) | ||
| 病理类型 | χ 2=2.143 | 0.343 | ||
| 浸润性导管癌 | 232(82.27) | 104(85.95) | ||
| 浸润性小叶癌 | 8(2.84) | 5(4.13) | ||
| 其他 | 42(14.89) | 12(9.92) | ||
| BI-RADS分级 | χ 2=2.617 | 0.624 | ||
| 3类 | 2(0.71) | 2(1.65) | ||
| 4a类 | 37(13.12) | 18(14.88) | ||
| 4b类 | 81(28.72) | 34(28.10) | ||
| 4c类 | 97(34.40) | 34(28.10) | ||
| 5类 | 65(23.05) | 33(27.27) | ||
| 微钙化 | χ 2=0.088 | 0.767 | ||
| 是 | 160(56.74) | 66(54.55) | ||
| 否 | 122(43.26) | 55(45.45) | ||
| CEA | χ 2=2.731 | 0.098 | ||
| ≥4.70ng/ml | 21(7.45) | 16(13.22) | ||
| <4.70ng/ml | 261(92.55) | 105(86.78) | ||
| 肿块位置 | χ 2=0.075 | 0.784 | ||
| 左乳 | 155(54.96) | 64(52.89) | ||
| 右乳 | 125(45.04) | 57(47.11) |
表2 训练集和验证集中不同HER2 表达组临床病理学特征比较[例(%)] |
| 参数 | 训练集(282例) | 验证集(121例) | ||||
|---|---|---|---|---|---|---|
| HER2阴性(195例) | HER2阳性(87例) | P值 | HER2阴性(96例) | HER2阳性(25例) | P值 | |
| 年龄(岁,±s) | 55.36±13.78 | 55.21±10.90 | 0.925 | 54.16±13.99 | 57.64±10.65 | 0.333 |
| 肿瘤直径(cm,±s) | 2.07±0.90 | 2.90±1.11 | <0.001 | 2.30±0.91 | 2.82±0.98 | 0.021 |
| BMI指数 | 0.346 | 0.579 | ||||
| <24 | 123(63.08) | 49(56.32) | 61(63.54) | 18(72.00) | ||
| ≥24 | 72(36.92) | 38(43.68) | 35(36.46) | 7(28.00) | ||
| 是否绝经 | 0.821 | 0.135 | ||||
| 是 | 137(70.26) | 63(72.41) | 68(70.83) | 22(88.00) | ||
| 否 | 58(29.74) | 24(27.59) | 28(29.17) | 3(12.00) | ||
| 病理类型 | 0.420 | 0.935 | ||||
| 浸润性导管癌 | 161(82.56) | 71(81.61) | 82(85.42) | 22(88.00) | ||
| 浸润性小叶癌 | 7(3.59) | 1(1.15) | 4(4.17) | 1(4.00) | ||
| 其他 | 27(13.85) | 15(17.24) | 10(10.42) | 2(8.00) | ||
| BI-RADS分级 | 0.233 | 0.352 | ||||
| 3类 | 2(1.03) | - | 2(2.08) | - | ||
| 4a类 | 28(14.36) | 9(10.34) | 13(13.54) | 5(20.00) | ||
| 4b类 | 57(29.23) | 24(27.59) | 29(30.21) | 5(20.00) | ||
| 4c类 | 70(35.90) | 27(31.03) | 29(30.21) | 5(20.00) | ||
| 5类 | 38(19.49) | 27(31.03) | 23(23.96) | 10(40.00) | ||
| 微钙化 | <0.001 | 0.081 | ||||
| 是 | 93(47.69) | 67(77.01) | 48(50.00) | 18(72.00) | ||
| 否 | 102(52.31) | 20(22.99) | 48(50.00) | 7(28.00) | ||
| CEA | 0.048 | 0.146 | ||||
| ≥4.70ng/ml | 10(5.13) | 11(12.64) | 10(10.42) | 6(24.00) | ||
| <4.70ng/ml | 185(94.87) | 76(87.36) | 86(89.58) | 19(76.00) | ||
| 肿块位置 | 0.663 | 1.000 | ||||
| 左乳 | 105(53.85) | 50(57.47) | 51(53.12) | 13(52.00) | ||
| 右乳 | 90(40.15) | 37(42.53) | 45(46.88) | 12(48.00) | ||
表3 不同模型在训练集和验证集中对HER2 表达的预测效能 |
| 组别 | AUC(95%CI) | 敏感度(%) | 特异度(%) | 准确性(%) |
|---|---|---|---|---|
| 瘤内模型 | ||||
| 训练集 | 0.791(0.727~0.845) | 83.6 | 65.5 | 78.7 |
| 验证集 | 0.733(0.630~0.836) | 76.0 | 70.8 | 74.4 |
| 瘤周模型 | ||||
| 训练集 | 0.786(0.739~0.844) | 65.1 | 85.1 | 74.8 |
| 验证集 | 0.739(0.623~0.856) | 48.0 | 94.8 | 76.0 |
| 瘤内+瘤周模型 | ||||
| 训练集 | 0.848(0.799~0.897) | 69.7 | 89.6 | 75.5 |
| 验证集 | 0.839(0.760~0.918) | 88.0 | 66.7 | 85.1 |
| 临床模型 | ||||
| 训练集 | 0.749(0.687~0.811) | 83.6 | 52.9 | 74.5 |
| 验证集 | 0.704(0.604~0.804) | 72.0 | 53.1 | 72.7 |
| 联合模型 | ||||
| 训练集 | 0.861(0.812~0.910) | 87.7 | 74.7 | 83.7 |
| 验证集 | 0.845(0.760~0.929) | 80.0 | 76.0 | 82.6 |
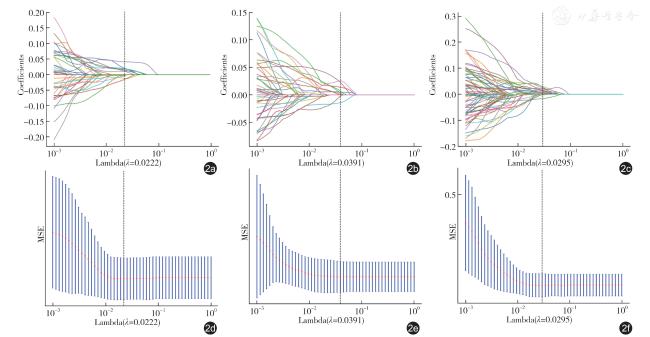
图2 套索回归筛选影像组学特征示意图。图a ~c 分别为瘤内、瘤周和瘤内+瘤周影像组学特征10 折交叉验证图,曲线表示对应自变量的变化趋势;图d ~f 为路径系数图,显示不同lambda 值下的均方误差(MSE) |
| 1 |
Siegel RL, Giaquinto AN, Jemal A.Cancer statistics, 2024[J].CA Cancer J Clin, 2024,74(1):12-49.
|
| 2 |
Elshazly AM, Gewirtz DA.An overview of resistance to Human epidermal growth factor receptor 2 (Her2) targeted therapies in breast cancer[J].Cancer Drug Resist, 2022, 5(2): 472-486.
|
| 3 |
von Arx C, De Placido P, Caltavituro A, et al.The evolving therapeutic landscape of trastuzumab-drug conjugates: Future perspectives beyond HER2-positive breast cancer[J].Cancer Treat Rev, 2023, 113: 102500.
|
| 4 |
Kazerouni AS, Hormuth DA 2nd, Davis T, et al.Quantifying tumor heterogeneity via MRI habitats to characterize microenvironmental alterations in HER2+ breast cancer[J].Cancers (Basel), 2022, 14(7): 1837.
|
| 5 |
Gillies RJ, Kinahan PE, Hricak H.Radiomics: images are more than pictures, they are data[J].Radiology, 2016, 278(2): 563-577.
|
| 6 |
吴佩琪.乳腺癌瘤周影像组学研究进展[J/CD].中华乳腺病杂志(电子版), 2023, 17(5): 301-304.
|
| 7 |
Wang J, Gao W, Lu M, et al.Development of an interpretable machine learning model for Ki-67 prediction in breast cancer using intratumoral and peritumoral ultrasound radiomics features[J].Front Oncol,2023,13: 1290313.
|
| 8 |
Ramtohul T, Djerroudi L, Lissavalid E, et al.Multiparametric MRI and radiomics for the prediction of HER2-zero, -low, and -positive breast cancers[J].Radiology, 2023, 308(2): e222646.
|
| 9 |
Deng Y, Lu Y, Li X, et al.Prediction of human epidermal growth factor receptor 2 (HER2) status in breast cancer by mammographic radiomics features and clinical characteristics: a multicenter study[J].Eur Radiol,2024, 34(8): 5464-5476.
|
| 10 |
张成孟, 丁治民, 陈鹏, 等.基于DCE-MRI 瘤内及瘤周影像组学联合TIC 分型及Ki-67 预测乳腺癌患者HER-2 表达[J].磁共振成像, 2023, 14(4): 68-75.
|
| 11 |
李周丽, 陈基明, 高静, 等.MRI 影像组学模型术前预测乳腺癌人表皮生长因子受体2 表达状态的价值[J].磁共振成像, 2023, 14(4): 82-88.
|
| 12 |
Wu L, Zhao Y, Lin P, et al.Preoperative ultrasound radiomics analysis for expression of multiple molecular biomarkers in mass type of breast ductal carcinoma in situ[J].BMC Med Imaging, 2021, 21(1): 84.
|
| 13 |
Xu H, Liu J, Chen Z, et al.Intratumoral and peritumoral radiomics based on dynamic contrast-enhanced MRI for preoperative prediction of intraductal component in invasive breast cancer[J].Eur Radiol,2022, 32(7): 4845-4856.
|
| 14 |
Li C, Song L, Yin J.Intratumoral and peritumoral radiomics based on functional parametric maps from breast DCE-MRI for prediction of HER-2 and Ki-67 Status[J].J Magn Reson Imaging, 2021, 54(3): 703-714.
|
| 15 |
黄贵廉, 陈智毅.乳腺癌超声征象与分子标志物的相关性研究进展[J].中国医学影像学杂志, 2021, 29(1): 86-88, 92.
|
/
| 〈 |
|
〉 |