
2025 , Vol. 22 >Issue 04: 321 - 327
DOI: https://doi.org/10.3877/cma.j.issn.1672-6448.2025.04.007
超声特征联合卵巢恶性肿瘤风险算法预测上皮性卵巢癌亚型的应用价值
Copy editor: 汪荣
收稿日期: 2025-03-06
网络出版日期: 2025-06-09
基金资助
同济大学“医学+ X”交叉研究项目(2025-0555-YB-05)
版权
Value of ultrasound features combined with ROMA index in predicting subtypes of epithelial ovarian cancer
Received date: 2025-03-06
Online published: 2025-06-09
Copyright
目的
探讨超声特征联合卵巢恶性肿瘤风险算法(ROMA)预测Ⅰ型与Ⅱ型上皮性卵巢癌(EOC)的临床应用价值。
方法
回顾性纳入2021 年1 月至2024 年1 月经同济大学附属妇产科医院(上海市第一妇婴保健院)手术病理证实为EOC 的患者195 例,且治疗前均行经阴道超声检查,其中Ⅰ型EOC 患者64 例,Ⅱ型EOC 患者131 例。比较2 组病例超声特征之间的差异,采用多因素Logistic 回归分析筛选Ⅱ型EOC 的独立预测因素。通过ROC 曲线分析ROMA 指数、超声特征及两者联合预测EOC 亚型的效能。
结果
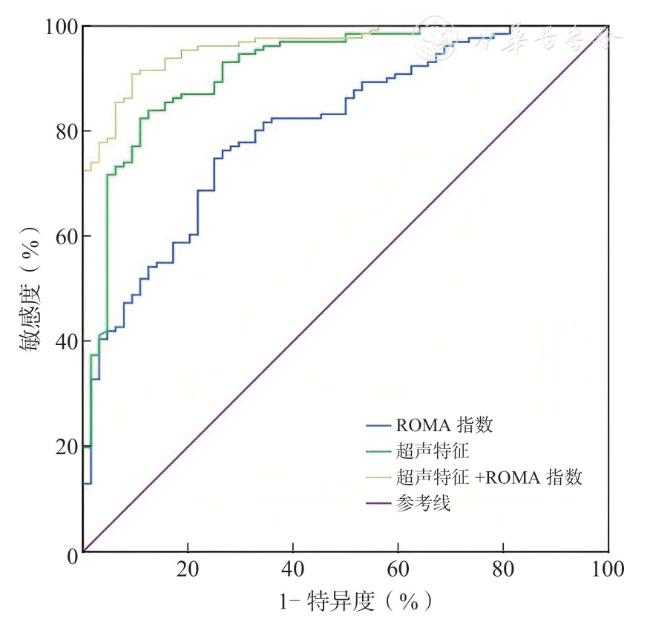
Ⅱ型EOC 多表现为实性病变(67/131,51.14%),而Ⅰ型EOC 多表现为单房囊实性病变(29/64,45.3%)。Ⅰ型EOC 多为单侧病变(58/64,90.6%),Ⅱ型EOC 多为双侧病变(85/131,64.9%),且常伴有腹水(69/131,52.67%)。Ⅱ型EOC 囊性部分回声通常为无回声(43/64,67.19%),且多见乳头状突起(80/131,61.07%),而Ⅰ型EOC 囊性部分回声通常表现为非无回声(38/54,70.4%),且乳头状突起相对少(28/64,43.7%)。2 组上述差异均有统计学意义(P均<0.05)。ROMA 指数取临界值58.48%时,对Ⅰ型与Ⅱ型EOC 的预测效能最高,ROC 曲线下面积(AUC)为0.805,其敏感度、特异度、阳性预测值、阴性预测值分别为74.8%、75.0%、57.8%、82.4%;超声特征预测的AUC 为0.919,其敏感度、特异度、阳性预测值、阴性预测值分别为82.4%、89.1%、73.4%、91.6%;超声特征与ROMA 结合显示出最高的诊断性能,AUC 为0.963,敏感度、特异度、阳性预测值、阴性预测值分别为90.8%、90.6%、84.4%、92.4%。
结论
ROMA 及超声特征对Ⅰ型与Ⅱ型EOC 均具有一定预测价值,超声特征与ROMA 联合应用效能最优。
关键词: 上皮性卵巢癌; 超声检查; 卵巢恶性肿瘤风险算法
杨宏宇 , 李克婷 , 孙传青 , 任敏 . 超声特征联合卵巢恶性肿瘤风险算法预测上皮性卵巢癌亚型的应用价值[J]. 中华医学超声杂志(电子版), 2025 , 22(04) : 321 -327 . DOI: 10.3877/cma.j.issn.1672-6448.2025.04.007
Objective
To assess the clinical value of ultrasound features combined with the risk of ovarian malignancy algorithm (ROMA) index in predicting type I and type II epithelial ovarian cancer(EOC).
Methods
A total of 195 patients with EOC confirmed by surgical pathology at Tongji University Affiliated Obstetrics and Gynecology Hospital (Shanghai First Maternity and Infant Hospital) from January 2021 to January 2024 were retrospectively included, and all patients underwent transvaginal ultrasound examination before treatment.Among them, 64 patients had type I EOC and 131 had type II.The differences in ultrasound features between the two groups were compared, and multivariate Logistic regression analysis was used to screen the independent predictors of type II EOC.The efficacy of ROMA index, ultrasound features, and their combination in predicting EOC subtypes was assessed by receiver operating characteristic(ROC) curve analysis.
Results
Type II EOC was mostly solid lesions (67/131, 51.14%), while type I EOC was mostly single-chamber cystic-solid lesions (29/64, 45.3%).Type I EOC was mostly unilateral lesions(58/64, 90.6%), while type II EOC was mostly bilateral lesions (85/131, 64.9%), and often accompanied by ascites (69/131, 52.67%).The cystic part of type II EOC usually had anechoic echoes (43/64, 67.19%), and papillary protrusions were more common (80/131, 61.07%), while the cystic part of type I EOC usually had non-anechoic echoes (38/54, 70.4%), and papillary protrusions were relatively rare (28/64, 43.7%).All the above differences between the two groups were statistically significant (P<0.05).When the critical value of ROMA index was set at 58.48%, it had the highest predictive efficacy for type I and type II EOC, with an area under the ROC curve (AUC) of 0.805, and its sensitivity, specificity, positive predictive value, and negative predictive value were 74.8%, 75.0%, 57.8%, and 82.4%, respectively.The AUC of ultrasound feature prediction was 0.919, with a sensitivity, specificity, positive predictive value, and negative predictive value of 82.4%, 89.1%, 73.4%, and 91.6%, respectively.The combination of ultrasound features and ROMA index showed the highest diagnostic performance, with an AUC of 0.963, and a sensitivity, specificity, positive predictive value, and negative predictive value of 90.8%, 90.6%, 84.4%, and 92.4%, respectively.
Conclusion
ROMA index and ultrasound features have appreciated predictive value for type I and type II EOC, and the combination of ultrasound features and ROMA index has the best efficacy.
 ±s 表示,2 组间比较采用独立样本t 检验;不符合正态分布则以M(Q1,Q3)表示,2 组间比较采用Mann Whitney 非参数检验。计数资料以例(%)表示,组间比较采用χ2 检验或Fisher 精确概率法。将单因素分析中有统计学意义的超声指标纳入多因素Logistic 回归分析筛选Ⅱ型EOC 的独立危险因素。通过绘制ROC曲线计算曲线下面积(area under curve,AUC),依据最大约登指数计算ROMA 鉴别Ⅰ型和Ⅱ型EOC的最佳临界值;并应用ROC 曲线分析超声特征单独及联合ROMA 指数用于预测Ⅱ型EOC 的效能。P<0.05 为差异有统计学意义。
表1 Ⅰ型与Ⅱ型EOC 患者临床病理资料分析[例(%)] |
| 资料 | Ⅰ型EOC 组(n=64) | Ⅱ型EOC 组(n=131) | 统计值 | P值 |
|---|---|---|---|---|
| 年龄[ 岁,M ( Q1, Q3 )] | 49(41.25,58.75) | 63(53.60,68.25) | Z=-3.214 | 0.004 |
| 月经状态 | χ 2=16.793 | < 0.001 | ||
| 绝经前 | 34(53.1) | 31(23.66) | ||
| 绝经后 | 30(46.9) | 100(76.34) | ||
| FIGO 分期 | χ 2=66.120 | < 0.001 | ||
| I 期 | 30(46.88) | 17(12.98) | ||
| Ⅱ期 | 25(39.06) | 15(11.45) | ||
| Ⅲ期 | 7(10.94) | 50(38.17) | ||
| Ⅳ期 | 2(3.12) | 49(37.40) | ||
| 子宫内膜异位症 | χ 2=56.378 | < 0.001 | ||
| 无 | 28(43.75) | 121(92.37) | ||
| 有 | 36(56.25) | 10(7.63) |
注:EOC 为上皮性卵巢癌;FIGO 为国际妇产科联盟 |
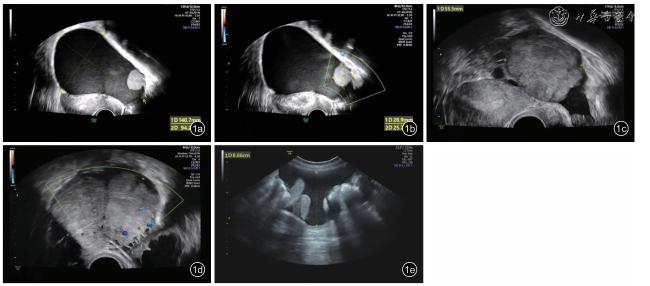
图1 上皮性卵巢癌(EOC)超声图像。图a 为Ⅰ型EOC 患者超声表现为单房囊实性病变;图b 示Ⅰ型EOC 患者血流评分为2 分;图c 为Ⅱ型EOC 患者超声表现为实性病变;图d 示Ⅱ型EOC患者血流评分为3 分;图e 示Ⅱ型EOC患者存在腹水 |
表2 Ⅰ型EOC 组与Ⅱ型EOC 组的超声特征比较[例(%)] |
| 超声特征 | Ⅰ型EOC 组(n=64) | Ⅱ型EOC 组(n=131) | 统计值 | P值 |
|---|---|---|---|---|
| 病变最大径(mm, ± s ) | 104.50±51.24 | 95.51±49.18 | t= 1.044 | 0.051 |
| 单/ 双侧病变 | χ 2=53.231 | < 0.001 | ||
| 单侧 | 58(90.6) | 46(35.1) | ||
| 双侧 | 6(9.4) | 85(64.9) | ||
| 病变类型 | χ 2=53.755 | < 0.001 | ||
| 单房囊性病变 | 0(0) | 0(0) | ||
| 多房囊性病变 | 0(0) | 0(0) | ||
| 单房囊实性病变 | 29(45.3) | 6(4.59) | ||
| 多房囊实性病变 | 25(39.1) | 58(44.27) | ||
| 实性病变 | 10(15.6) | 67(51.14) | ||
| 最大实性成分[mm,M ( Q1, Q3 )] | 47.87(31.77,73.41) | 56.88(39.56,69.12) | Z=-0.434 | 0.791 |
| 囊性部分回声 | χ 2=45.529 | < 0.001 | ||
| 无回声 | 16(29.6) | 43(67.19) | ||
| 非无回声(低回声或高回声等) | 38(70.4) | 21(32.81) | ||
| 乳头状突起 | χ 2=16.386 | 0.002 | ||
| 无 | 36(56.3) | 51(38.93) | ||
| 有 | 28(43.7) | 80(61.07) | ||
| 血流评分 | χ 2=0.194 | 0.758 | ||
| 1 ~ 3 | 35(54.7) | 55(41.98) | ||
| 4 | 29(45.3) | 76(58.02) | ||
| 腹水 | χ 2=22.375 | < 0.001 | ||
| 无 | 53(82.8) | 62(47.33) | ||
| 有 | 11(17.2) | 69(52.67) |
注:EOC 为上皮性卵巢癌 |
表3 Ⅱ型EOC 超声特征的多因素Logistic 回归分析 |
| 因素 | 参照组 | 比较组 | β 值 | SE | Wald 2值 | P值 | OR 值 | 95%CI |
|---|---|---|---|---|---|---|---|---|
| 单/ 双侧病变 | 单侧病变 | 双侧病变 | 2.621 | 0.555 | 22.335 | < 0.001 | 13.754 | 4.638 ~ 40.790 |
| 病变类型 | 单房囊实性病变 | 多房囊实性病变 | 1.967 | 0.662 | 8.833 | 0.003 | 7.146 | 1.954 ~ 26.141 |
| 实性病变 | 2.158 | 0.912 | 5.602 | 0.018 | 8.657 | 1.449 ~ 51.718 | ||
| 囊性部分回声 | 非无回声(低回声或高回声等) | 无回声 | 0.775 | 0.472 | 2.696 | 0.101 | 2.171 | 0.861 ~ 5.478 |
| 乳头状突起 | 无 | 有 | 0.061 | 0.635 | 0.009 | 0.924 | 1.063 | 0.306 ~ 3.688 |
| 腹水 | 无 | 有 | 1.543 | 0.537 | 8.252 | 0.004 | 4.678 | 1.633 ~ 13.404 |
注:EOC 为上皮性卵巢癌 |
表4 ROMA 指数、超声特征单独及联合应用预测Ⅱ型EOC 的效能分析 |
| 预测方法 | AUC | 95%CI | 敏感度(%) | 特异度(%) | 阳性预测值(%) | 阴性预测值(%) |
|---|---|---|---|---|---|---|
| ROMA 指数 | 0.805 | 0.743 ~ 0.868 | 74.8 | 75.0 | 57.8 | 82.4 |
| 超声特征 | 0.919 | 0.876 ~ 0.961 | 82.4 | 89.1 | 73.4 | 91.6 |
| ROMA 指数+ 超声特征 | 0.963 | 0.940 ~ 0.985 | 90.8 | 90.6 | 84.4 | 92.4 |
注:EOC 为上皮性卵巢癌;ROMA 为卵巢恶性肿瘤风险算法 |
| 1 |
Webb PM, Jordan SJ.Global epidemiology of epithelial ovarian cancer[J].Nat Rev Clin Oncol, 2024, 21(5): 389-400.
|
| 2 |
Bray F, Laversanne M, Sung H,et al.Global cancer statistics 2022:GLOBOCAN estimates of incidence and mortality worldwide for 36 cancers in 185 countries[J].CA Cancer J Clin, 2024, 74(3): 229-263.
|
| 3 |
Lu H, Arshad M, Thornton A, et al.A mathematical-descriptor of tumor-mesoscopic-structure from computed-tomography images annotates prognostic- and molecular-phenotypes of epithelial ovarian cancer[J].Nat Commun, 2019, 10(1): 764.
|
| 4 |
Kurman RJ, Shih leM.Pathogenesis of ovarian cancer: lessons from morphology and molecular biology and their clinical implications[J].Int J Gynecol Pathol, 2008, 27(2): 151-160.
|
| 5 |
Kurman RJ, Shih leM.The dualistic model of ovarian carcinogenesis:revisited, revised, and expanded[J].Am J Pathol, 2016, 186(4): 733-747.
|
| 6 |
Srinivasamurthy BC, Ramamoorthi S.The progression and prospects of the gene expression profiling in ovarian epithelial cancer[J].Gynecol Minim Invasive Ther, 2024, 13(3): 141-145.
|
| 7 |
Lu Z, Chen J.Introduction of WHO classification of tumours of female reproductive organs, fourth edition[J].Zhonghua Bing Li Xue Za Zhi.2014, 43(10): 649-650.
|
| 8 |
Moore RG, Miller MC, Disilvestro P, et al.Evaluation of the diagnostic accuracy of the risk of ovarian malignancy algorithm in women with a pelvic mass[J].Obstet Gynecol, 2011, 118(2 Pt 1): 280-288.
|
| 9 |
Campbell S, Gentry-Maharaj A.The role of transvaginal ultrasound in screening for ovarian cancer[J].Climacteric, 2018, 21(3): 221-226.
|
| 10 |
国家超声医学质量控制中心,北京市超声医学质量控制和改进中心.卵巢病变超声诊断质量控制指标专家共识[J].中华医学超声杂志(电子版), 2024, 21(7): 653-656.
|
| 11 |
Mutch DG, Prat J.2014 FIGO staging for ovarian, fallopian tube and peritoneal cancer[J].Gynecol Oncol, 2014, 133(3): 401-404.
|
| 12 |
Alcázar JL, Utrilla-Layna J, Mínguez JÁ, et al.Clinical and ultrasound features of type I and type II epithelial ovarian cancer[J].Int J Gynecol Cancer, 2013, 23(4): 680-684.
|
| 13 |
Gates MA, Rosner BA, Hecht JL, et al.Risk factors for epithelial ovarian cancer by histologic subtype[J].Am J Epidemiol, 2010,171(1): 45-53.
|
| 14 |
Moore RG, McMeekin DS, Brown AK,et al.A novel multiple marker bioassay utilizing HE4 and CA125 for the prediction of ovarian cancer in patients with a pelvic mass[J].Gynecol Oncol, 2009, 112(1): 40-46.
|
| 15 |
Dochez V, Caillon H, Vaucel E, et al.Biomarkers and algorithms for diagnosis of ovarian cancer: CA125, HE4, RMI and ROMA, a review[J].J Ovarian Res, 2019, 12(1): 28.
|
| 16 |
Feng P, Chen T, Wischhusen J, et al.The diagnostic performance of the Mindray system in detecting CA125 and HE4 for patients with ovarian cancer[J].Transl Cancer Res, 2024, 13(8): 4474-4484.
|
| 17 |
Braicu EI, Krause CL, Torsten U, et al.HE4 as a serum biomarker for the diagnosis of pelvic masses: a prospective, multicenter study in 965 patients[J].BMC Cancer, 2022, 22(1): 831.
|
| 18 |
Luo HJ, Hu ZD, Cui M, et al.Diagnostic performance of CA125, HE4,ROMA, and CPH-I in identifying primary ovarian cancer[J].J Obstet Gynaecol Res, 2023, 49(3): 998-1006.
|
/
| 〈 |
|
〉 |