
2025 , Vol. 22 >Issue 09: 850 - 857
DOI: https://doi.org/10.3877/cma.j.issn.1672-6448.2025.09.010
基于人工智能技术评价江西省孕11~13+6周产前超声筛查质量现状及提出能力提升对策
通信作者:
周小军,Email:zxj12zxj@sohu.comCopy editor: 吴春凤
收稿日期: 2025-05-22
网络出版日期: 2025-12-24
版权
Quality assessment and capacity enhancement in prenatal ultrasound screening at 11-13+6 weeks of gestation: an artificial intelligence-based study in Jiangxi Province
Corresponding author:
Zhou Xiaojun, Email: zxj12zxj@sohu.comReceived date: 2025-05-22
Online published: 2025-12-24
Copyright
了解江西省孕11~13+6周胎儿产前超声筛查质量现状,分析早孕期超声筛查切面图存在的技术问题与短板,提出针对性的能力提升对策。
利用“产前超声人工智能(AI)智慧云平台”收集2024年1月—12月江西省106家医疗机构共558名超声医师的49 659张孕11~13+6周胎儿超声筛查切面图的AI质量评分。超声筛查切面图包括胎儿2个质量控制超声切面图(头臀长切面与颈项透明层切面)与多个非质量控制超声切面图。采用t检验与F检验分析不同分类医疗机构、不同分类超声医师、各地市的早孕期超声筛查切面图质量评分的差异,以及不同切面结构标识质量置信系数的差异。
妇幼医院早孕期超声筛查切面图质量评分高于综合医院[(78.8±18.0)分 vs(77.5±18.0)分,t=6.38,P<0.001];三级医院切面图质量评分高于二级医院[(81.0±14.7)分 vs(76.2±20.5)分,t=29.38,P<0.001];省级、市级、县级医院的切面图像质量评分逐级降低[(83.2±13.8)分 vs(80.4±14.9)分 vs(76.7±20.1)分,F=370.70,P<0.001]。职称越高、超声工龄越长的医师的各切面质量评分均越高,硕士以上学历医师各切面质量评分均高于本科、专科学历医师,差异均具有统计学意义(P均<0.001)。江西省11个地市早孕期筛查切面质量评分差异均具有统计学意义(P均<0.001)。头臀长切面与颈项透明层切面分别包含12个结构标识,各切面结构标识质量置信系数比较,差异均具有统计学意义(P均<0.001)。切面的主要质量问题为:重要的结构标识显示不清晰、放大比例不足、不宜出现的结构未避免。
江西省不同分类医疗机构、超声医师、地市的孕11~13+6周胎儿产前超声切面质量差异较大。提升江西省早孕期超声筛查质量水平,宜以综合医院、市县级医院、低职称与低学历及低年资超声医师为主,围绕各结构标识的清晰度、放大比例、避免不宜出现结构等质量控制标准开展培训教育,提升各级各类超声医师的检查水平,提高江西省早孕期超声筛查整体能力。
周欣 , 梁豪进 , 邓振宇 , 肖菊花 , 周小军 . 基于人工智能技术评价江西省孕11~13+6周产前超声筛查质量现状及提出能力提升对策[J]. 中华医学超声杂志(电子版), 2025 , 22(09) : 850 -857 . DOI: 10.3877/cma.j.issn.1672-6448.2025.09.010
To investigate the current quality status of prenatal ultrasound screening for fetuses at 11-13+6 weeks of gestation in Jiangxi Province, analyze the technical issues and shortcomings in early pregnancy ultrasound screening images, propose targeted capacity improvement strategies, and provide a scientific basis for optimizing early pregnancy ultrasound screening services in Jiangxi Province.
A total of 49 659 ultrasound screening images of fetuses at 11-13+6 weeks of gestation, obtained from 558 ultrasound physicians across 106 medical institutions in Jiangxi Province between January and December 2024, were collected via the "intelligent ultrasonic quality control system". AI-generated quality scores for these images were analyzed. The ultrasound screening views included two quality-controlled fetal views (crown-rump length [CRL] and nuchal translucency [NT] views) as well as multiple non-quality-controlled views. Independent samples t-test and one-way analysis of variance (ANOVA, F-test) were used to compare quality scores of early pregnancy ultrasound screening images across different types of medical institutions, categories of ultrasound physicians, and prefecture-level cities. Additionally, differences in quality confidence coefficients for structural markers in different views were analyzed.
The quality scores of early pregnancy ultrasound screening images in maternal and children hospitals were significantly higher than that in general hospitals [(78.8±18.0) vs (77.5±18.0), t=6.38, P<0.001]. Tertiary hospitals had significantly higher image quality scores than secondary hospitals [(81.0±14.7) vs (76.2±20.5), t=29.38, P<0.001]. Image quality scores decreased progressively from provincial-level hospitals to municipal-level hospitals and then to county-level hospitals [(83.2±13.8) vs (80.4±14.9) vs (76.7±20.1), F=370.70, P<0.001]. Higher physician titles and longer ultrasound practice experience were associated with higher quality scores for all views. Physicians with a master's degree or above achieved significantly higher quality scores for all views compared to those with a bachelor's degree or junior college education (all P<0.001). Significant differences in image quality scores were observed among 11 prefecture-level cities in Jiangxi Province (all P<0.001). Both CRL and NT screening views contained 12 structural markers each, and there were statistically significant differences in quality confidence coefficients for structural markers across all views (all P<0.001). The main quality issues of the images included: unclear display of important structural markers, insufficient magnification, and failure to avoid unwanted structures.
Significant differences exist in the quality of prenatal ultrasound images for fetuses at 11-13+6 weeks of gestation across different types of medical institutions, ultrasound physicians, and prefecture-level cities in Jiangxi Province. To improve the quality of early pregnancy ultrasound screening in Jiangxi Province, priority should be given to general hospitals, municipal/county-level hospitals, and ultrasound physicians with lower titles, lower academic qualifications, and less clinical experience. Training and education should focus on quality control standards, such as the clarity of structural markers, appropriate magnification, and avoidance of unwanted structures. This will enhance the examination proficiency of ultrasound physicians at all levels and types, thereby improving the overall capacity of early pregnancy ultrasound screening in Jiangxi Province.
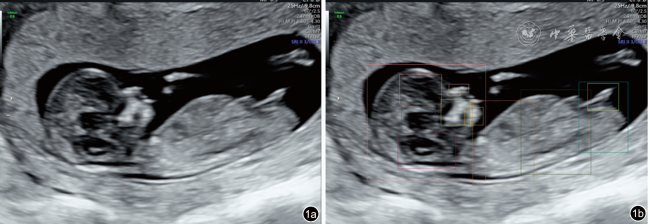
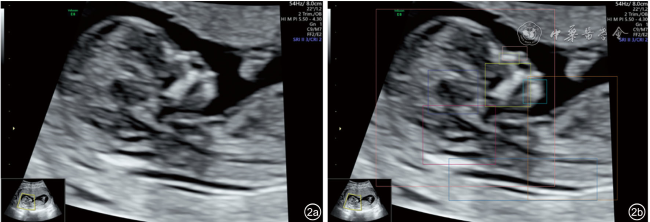
图1 产前超声人工智能智慧云平台对胎儿头臀长切面质量控制超声图像。质量控制结果包括检测结构显示情况(鼻骨、鼻尖和鼻前皮肤、上颌骨、下颌骨、间脑、菱脑、生殖器、侧脑室、头、胸、腹、臀)和总体评价,总体评价包括切面名称、切面质量(标准)、切面评分(94分)、结构置信系数评价(鼻骨:0.53,鼻尖和鼻前皮肤:0.68,上颌骨:0.86,下颌骨:0.46,间脑:0.89,菱脑:0.83,生殖器:0.80,侧脑室:0.69,头:0.89,胸:0.80,腹:0.81,臀:0.78)及不足原因。图a为原图,图b为质量控制标注图 |

表1 江西省孕11~13+6周胎儿超声筛查切面调查对象基本情况表 |
| 类别 | 数量 | 构成比(%) |
|---|---|---|
| 参评医疗机构(家) | 106 | |
| 经营性质 | ||
| 妇幼医院 | 67 | 63.2 |
| 综合医院 | 39 | 36.8 |
| 医院等级 | ||
| 三级医院 | 34 | 32.1 |
| 二级医院 | 72 | 67.9 |
| 医院级别 | ||
| 省级医院 | 5 | 4.7 |
| 市级医院 | 21 | 19.8 |
| 县级医院 | 80 | 75.5 |
| 参评医师(人) | 558 | |
| 职称 | ||
| 高级 | 112 | 20.1 |
| 中级 | 341 | 61.1 |
| 初级 | 105 | 18.8 |
| 学历 | ||
| 硕士以上 | 41 | 7.3 |
| 本科 | 511 | 91.6 |
| 专科 | 6 | 1.1 |
| 超声工龄 | ||
| <5年 | 16 | 2.9 |
| 5~15年 | 280 | 50.2 |
| >15年 | 262 | 47.0 |
表2 2024年江西省不同医疗机构孕11~13+6周胎儿产前超声切面质量评分(分, |
| 医疗机构 | 质控切面 | 合计 | ||||||
|---|---|---|---|---|---|---|---|---|
| CRL切面 | NT切面 | 小计 | ||||||
| 数量 | 质量评分 | 数量 | 质量评分 | 数量 | 质量评分 | 数量 | 质量评分 | |
| 经营性质 | ||||||||
| 妇幼医院 | 15 882 | 77.5±15.4 | 15 017 | 82.8±14.6 | 30 899 | 80.1±15.2 | 40 084 | 78.8±18.0 |
| 综合医院值 | 3604 | 75.9±15.7 | 2747 | 81.3±16.1 | 6351 | 78.2±16.1 | 9575 | 77.5±18.0 |
| t值 | 5.81 | 4.57 | 8.51 | 6.38 | ||||
| P值 | <0.001 | <0.001 | <0.001 | <0.001 | ||||
| 医院等级 | ||||||||
| 三级医院 | 9596 | 78.0±14.8 | 9330 | 83.0±14.1 | 18 926 | 80.5±14.6 | 24 571 | 81.0±14.7 |
| 二级医院 | 9890 | 76.5±16.1 | 8434 | 82.0±15.6 | 18 324 | 79.0±16.1 | 25 088 | 76.2±20.5 |
| t值 | 7.04 | 4.14 | 8.95 | 29.83 | ||||
| P值 | <0.001 | <0.001 | <0.001 | <0.001 | ||||
| 医院级别 | ||||||||
| 省级医院 | 1792 | 81.9±13.1 | 1692 | 85.9±11.1 | 3484 | 83.8±12.3 | 3664 | 83.2±13.8 |
| 市级医院 | 6671 | 76.5±15.1 | 6546 | 82.1±14.7 | 13 217 | 79.3±15.1 | 18 672 | 80.4±14.9 |
| 县级医院 | 11 023 | 76.9±15.9 | 9526 | 82.2±15.4 | 20 549 | 79.4±15.9 | 27 323 | 76.7±20.1 |
| F值 | 91.79 | 48.22 | 135.81 | 370.70 | ||||
| P值 | <0.001 | <0.001 | <0.001 | <0.001 | ||||
注:CRL为头臀长,NT为颈项透明层;小计为2个质控切面总和,合计为非质控切面和质控切面总和。a与省级医院比较,差异具有统计学意义(P均<0.001),b与市级医院比较,差异具有统计学意义(P<0.001) |
表3 2024年江西省不同超声医师孕11~13+6周胎儿产前超声切面质量评分(分, |
| 超声医师 | 质控切面 | 合计 | ||||||
|---|---|---|---|---|---|---|---|---|
| CRL切面 | NT切面 | 小计 | ||||||
| 数量 | 质量评分 | 数量 | 质量评分 | 数量 | 质量评分 | 数量 | 质量评分 | |
| 职称 | ||||||||
| 高级 | 4039 | 79.9±14.9 | 3773 | 84.8±13.2 | 7812 | 82.3±14.3 | 10 121 | 80.4±18.0 |
| 中级 | 11 329 | 77.2±15.2 | 10 148 | 82.3±14.8 | 21 477 | 79.6±15.2 | 28 362 | 79.0±17.2 |
| 初级 | 4118 | 74.7±16.3 | 3843 | 81.0±16.0 | 7961 | 77.7±16.4 | 11 176 | 75.7±20.3 |
| F值 | 114.99 | 66.38 | 173.15 | 205.26 | ||||
| P值 | <0.001 | <0.001 | <0.001 | <0.001 | ||||
| 学历 | ||||||||
| 硕士以上 | 1466 | 81.4±12.3 | 1160 | 84.7±12.0 | 2626 | 82.9±2.3 | 4501 | 81.6±13.7 |
| 本科 | 17 885 | 76.9±15.7 | 16 485 | 82.4±15.0 | 34 370 | 79.5±15.6 | 44 902 | 78.3±18.4 |
| 专科 | 135 | 76.7±15.4 | 119 | 84.9±11.5 | 254 | 80.5±14.3 | 256 | 80.2±15.0 |
| F值 | 58.54 | 15.39 | 58.99 | 70.06 | ||||
| P值 | <0.001 | <0.001 | <0.001 | <0.001 | ||||
| 超声工龄 | ||||||||
| >15年 | 9605 | 78.0±15.5 | 8988 | 83.2±14.3 | 18 593 | 80.5±15.2 | 26 078 | 80.0±17.1 |
| 5~15年 | 9561 | 76.6±15.4 | 8462 | 81.9±15.3 | 18 023 | 79.1±15.6 | 22 727 | 77.1±18.8 |
| <5年 | 320 | 74.4±15.6 | 314 | 81.1±16.1 | 634 | 77.7±16.2 | 854 | 75.4±21.0 |
| F值 | 26.04 | 18.32 | 45.99 | 172.63 | ||||
| P值 | <0.001 | <0.001 | <0.001 | <0.001 | ||||
注:CRL为头臀长,NT为颈项透明层;小计为2个质控切面总和,合计为非质控切面和质控切面总和。不同职称医师两两比较:a与高级职称医师相比,差异具有统计学意义(CRL切面:P均<0.001;NT切面:P均<0.001;质控切面:P均<0.001;总切面:P均<0.001),b与中级职称医师相比,差异具有统计学意义(CRL切面、NT切面、质控切面、总切面:P均<0.001);不同学历超声医师两两比较:a与硕士以上学历医师相比,差异具有统计学意义(CRL切面:P<0.001、=0.002;NT切面:P<0.001;质控切面:P<0.001、=0.035;总切面:P<0.001);不同超声工龄医师两两比较:a与>15年医师相比,差异具有统计学意义(CRL切面:P均<0.001;NT切面:P<0.001;质控切面:P均<0.001;总切面:P均<0.001) |
表4 江西省各地市孕11~13+6周胎儿产前超声筛查切面质量评分比较(分, |
| 地市 | 质控切面 | 合计 | ||||||
|---|---|---|---|---|---|---|---|---|
| CRL切面 | NT切面 | 小计 | ||||||
| 数量 | 质量评分 | 数量 | 质量评分 | 数量 | 质量评分 | 数量 | 质量评分 | |
| 赣州市 | 3965 | 83.7±11.4 | 3939 | 86.5±10.2 | 7904 | 85.1±10.9 | 8228 | 84.8±11.5 |
| 南昌市 | 1806 | 80.1±14.1 | 1646 | 84.6±12.5 | 3452 | 82.3±13.5 | 3671 | 81.1±15.7 |
| 萍乡市 | 3443 | 72.7±15.5 | 3784 | 80.0±15.4 | 7227 | 76.5±15.9 | 10 463 | 79.5±15.1 |
| 吉安市 | 1706 | 79.3±15.0 | 1788 | 85.0±13.4 | 3494 | 82.2±14.5 | 4540 | 79.4±18.6 |
| 上饶市 | 1742 | 76.6±15.4 | 1357 | 81.0±16.2 | 3099 | 78.5±15.9 | 5257 | 78.0±17.6 |
| 新余市 | 422 | 75.8±15.2 | 302 | 80.7±15.8 | 724 | 77.8±15.6 | 1223 | 77.6±18.5 |
| 九江市 | 2709 | 77.1±15.0 | 2138 | 80.8±16.0 | 4847 | 78.8±15.6 | 6600 | 77.0±19.0 |
| 鹰潭市 | 320 | 71.1±19.4 | 235 | 82.9±14.8 | 555 | 76.1±18.7 | 1381 | 76.3±20.5 |
| 抚州市 | 1041 | 75.2±15.6 | 936 | 81.9±16.3 | 1977 | 78.4±16.3 | 2638 | 76.0±20.1 |
| 宜春市 | 1214 | 73.7±17.3 | 747 | 82.6±15.7 | 1961 | 77.1±17.2 | 2227 | 75.9±19.2 |
| 景德镇市 | 1118 | 69.9±18.0 | 892 | 74.3±20.6 | 2010 | 71.9±19.4 | 3431 | 66.0±20.1 |
| F值 | 158.79 | 83.48 | 226.21 | 315.054 | ||||
| P值 | <0.001 | <0.001 | <0.001 | <0.001 | ||||
注:CRL为头臀长,NT为颈项透明层;小计为2个质控切面总和,合计为非质控切面和质控切面总和 |
表5 CRL切面与NT切面2个质控切面结构标识的质量置信系数比较 |
| 结构 | 置信系数 | 结构 | 置信系数 |
|---|---|---|---|
| CRL切面(19 486张) | NT切面(17 764张) | ||
| 头 | 0.9±0.1 | 头 | 0.9±0.1 |
| 上颌骨 | 0.9±0.1 | 上颌骨 | 0.8±0.1 |
| 间脑 | 0.8±0.2 | 间脑 | 0.8±0.2 |
| 腹 | 0.8±0.1 | 菱脑 | 0.8±0.3 |
| 胸 | 0.8±0.1 | 胸 | 0.7±0.3 |
| 菱脑 | 0.7±0.3 | 鼻尖和鼻前皮肤 | 0.7±0.2 |
| 臀 | 0.7±0.1 | 颈后皮肤透明层 | 0.6±0.2 |
| 下颌骨 | 0.7±0.2 | 下颌骨呈圆点状 | 0.5±0.3 |
| 鼻尖和鼻前皮肤 | 0.5±0.3 | 鼻骨 | 0.5±0.2 |
| 生殖结节 | 0.4±0.4 | 侧脑室 | 0.4±0.3 |
| 侧脑室 | 0.4±0.3 | 腹 | 0.2±0.3 |
| 鼻骨 | 0.4±0.3 | 下颌骨呈长条形 | 0.1±0.2 |
| F值 | 14 458.77 | F值 | 18 392.08 |
| P值 | <0.001 | P值 | <0.001 |
注:CRL为头臀长,NT为颈项透明层 |
| 1 |
|
| 2 |
|
| 3 |
|
| 4 |
尹宏宇, 吴青青, 李晓菲. 颈后透明层和头臀长在妊娠11~13+6周双胎心脏畸形筛查中的价值[J/OL]. 中华医学超声杂志(电子版), 2024, 21(3): 251-256.
|
| 5 |
陈美池, 刘静华, 柯华玲, 等. 人工智能质控在提高孕11~13+6胎儿颈后透明层厚度超声检查图像合格率中的应用价值 [J]. 中国产前诊断杂志(电子版), 2024, 16(1): 10-15.
|
| 6 |
赵媛, 傅玉, 吴菊, 等. 孕11~13+6周胎儿NT≥6.0 mm孕妇妊娠结局的随访研究 [J]. 中国妇幼保健, 2018, 33(8): 1815-1818.
|
| 7 |
赵雪. 胎儿颈后透明层厚度超声检查联合孕中期四维超声系统检查对胎儿结构畸形的诊断价值分析 [J]. 中国医疗器械信息, 2024, 30(9): 93-95.
|
| 8 |
栗河舟, 张恒静, 王铭. 早孕期胎儿中枢神经系统超声规范化筛查[J/OL]. 中华医学超声杂志(电子版), 2022, 19(9): 882-887.
|
| 9 |
沈丽君, 陆佳佳, 钱燕芳, 等. 对基层医院进行产科超声标准化切面扫查培训的效果 [J]. 医药前沿, 2024, 14(33): 67-69, 73.
|
| 10 |
李胜利, 文华轩. 11~13+6周早孕期胎儿超声规范化扫查技术及判断标准 [J/CD]. 中华医学超声杂志(电子版), 2014, 11(1): 6-8.
|
| 11 |
徐玲, 王丽敏, 简练, 等. 品管圈在提高孕11~13+6周胎儿颈后透明层厚度超声检查图像质量控制中的应用效果[J/OL]. 中华医学超声杂志(电子版), 2021, 18(7): 664-669.
|
| 12 |
黄文兰, 谭莹, 彭桂艳, 等. 人工智能质控系统在11~13+6周胎儿颈后透明层超声标准切面判断中的应用 [J]. 中华超声影像学杂志, 2023, 32(9): 807-812.
|
| 13 |
中华医学会超声医学分会妇产超声学组, 国家卫生健康委妇幼司全国产前诊断专家组医学影像组. 超声产前筛查指南 [J]. 中华超声影像学杂志, 2022, 31(1): 1-12.
|
| 14 |
中国医师协会超声医师分会. 产科超声规范化培训考核标准中国专家共识(2022版) [J]. 2022, 31(5): 369-378.
|
| 15 |
王晶晶, 李琳, 孙丽娟, 等. 超声医师妇产超声知识水平的影响因素分析 [J]. 北京医学, 2024, 46(12): 1098-1101.
|
| 16 |
顾莉莉, 姜凡. 安徽省超声产前筛查切面图像质量现状调查情况及分析[J/OL]. 中华医学超声杂志(电子版), 2024, 21(7): 671-674.
|
| 17 |
陈彬, 严雨霖, 杜海雯, 等. 人工智能在产科超声中的应用进展 [J]. 医学综述, 2022, 28(14): 2903-2907.
|
/
| 〈 |
|
〉 |