
2023 , Vol. 20 >Issue 06: 598 - 604
DOI: https://doi.org/10.3877/cma.j.issn.1672-6448.2023.06.005
胎儿心脏定量分析技术对正常胎儿心脏形态及收缩功能的评价
Copy editor: 汪荣
收稿日期: 2022-08-18
网络出版日期: 2023-10-31
版权
Evaluation of normal fetal heart morphology and systolic function by fetal heart quantification technique
Received date: 2022-08-18
Online published: 2023-10-31
Copyright
应用胎儿心脏定量分析(Fetal HQ)技术评估正常胎儿心脏的形态及收缩功能,探讨该技术评估胎儿心功能的可行性。
收集2021年2月至2022年3月在宁夏医科大学总医院妇产中心功能检查部及北京大学第一医院宁夏妇女儿童医院(宁夏回族自治区妇幼保健院)超声科行中晚孕期超声检查的正常单胎孕妇230例。应用Fetal HQ技术定量得出230例正常胎儿四腔心舒张末期长径(L)、横径(TW)、心脏面积(A),左、右心室面积(ED-A)及长径(ED-L),评估胎儿心脏整体及左、右心室大小;测量四腔心舒张末期整体球形指数(GSI)及左、右心室24节段球形指数(SI)评估胎儿心脏形态;测量面积变化分数(FAC)、整体纵向应变(GLS)、左心室射血分数(LVEF)及左、右心室24节段短轴缩短率(FS)评估左、右心室收缩功能,并提供各参数对应的经胎龄校正后的Z值,设定其正常范围为-2~2。
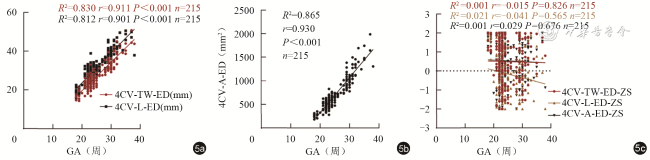
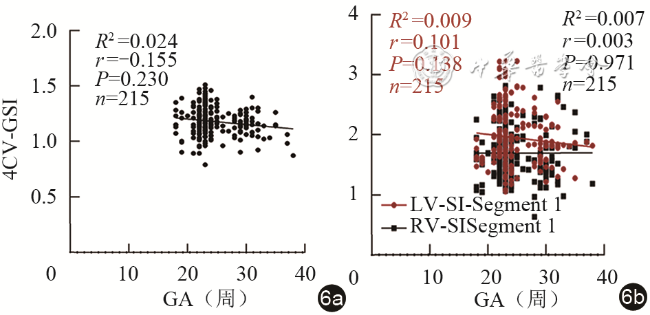
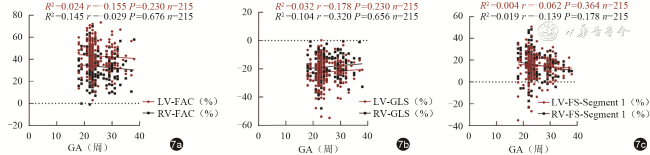
胎儿四腔心舒张末期L(r=0.901,P<0.001)、TW(r=0.911,P<0.001)、A(r=0.930,P<0.001)与孕龄呈线性相关。左心室ED-A、ED-L均大于右心室,差异具有统计学意义(P均<0.05)。胎儿四腔心舒张末期GSI以及胎儿左、右心室24节段各节段SI与孕龄均无明显相关性(P均>0.05)。胎儿左心室与右心室的24节段SI进行比较,第1~17、19~24节段差异具有统计学意义(P均<0.05),第18节段差异无统计学意义(P>0.05)。胎儿LVEF平均值为(52.79±1.28)%。胎儿左、右心室FAC、GLS及24节段FS与孕龄均无明显相关性(P均>0.05)。胎儿左心室FAC、GLS大于右心室,差异具有统计学意义(P均<0.05)。胎儿左心室与右心室的24节段FS比较,第1~3节段差异无统计学意义(P均>0.05),第4~24节段差异具有统计学意义(P均<0.05)。24节段SI、FS对应的Z值平均值均在正常范围内。
Fetal HQ技术能够提供多个参数定量分析胎儿心脏的大小、形态及收缩功能,其结果可靠且可行性较好,为胎儿心功能的评估提供了新的有效方法。
谭芳 , 杨娇娇 , 沈玉琴 , 李炎菲海 , 王海蕊 , 范思涵 , 纪学芹 . 胎儿心脏定量分析技术对正常胎儿心脏形态及收缩功能的评价[J]. 中华医学超声杂志(电子版), 2023 , 20(06) : 598 -604 . DOI: 10.3877/cma.j.issn.1672-6448.2023.06.005
To use the fetal heart quantification (Fetal HQ) technique to evaluate the morphology and systolic function of the normal fetal heart, and to explore the application value of this technique in evaluating fetal heart function.
From February 2021 to March 2022, 230 normal singleton pregnant women underwent ultrasound examination at the Functional Examination Department of the Maternity Center of the General Hospital of Ningxia Medical University and the Ultrasound Department of Ningxia Women's and Children's Hospital, Beijing University First Hospital (Ningxia Hui Autonomous Region Maternal and Child Health Hospital). Fetal HQ technique was used to quantitatively obtain the four-chamber end-diastolic length (L), transverse width (TW), heart area (A), and left and right ventricular A and L of 230 normal fetuses and to evaluate the size of the whole fetal heart and left and right ventricles. The global spherical index(GSI) and the spherical index (SI) of the 24 segments of the left and right ventricle were measured to evaluate the fetal heart shape. Fraction area change (FAC), global longitudinal strain (GLS), left ventricular ejection fraction (LVEF), and fractional shortening (FS) of the 24 segments of the left and right ventricles were measured to evaluate left and right ventricular systolic function, and the z values corresponding to each parameter were provided after gestational age correction, and the normal range was set at -2~2.
There was a linear correlation between fetal four-chamber end diastolic L (r=0.901, P<0.001), TW (r=0.911, P<0.001), and A (r=0.930, P<0.001) and gestational age. The ED-A and ED-L of the left ventricle were significantly larger than those of the right ventricle (P<0.05). There was no significant correlation between fetal four-chamber end diastolic GSI and SI of the 24 segments of the fetal left and right ventricle and gestational age (P>0.05). When comparing the SI of the 24 segments between the fetal left ventricle and right ventricle, the differences in segments 1-17 and 19-24 were statistically significant (P<0.05), while the differences in the 18th segment were not statistically significant (P>0.05). The average fetal LVEF was (52.79±1.28)%. There was no significant correlation between FAC, GLS, and FS of the 24 segments of the fetal left and right ventricle and gestational age (P>0.05). The FAC and GLS of the fetal left ventricle were significantly larger than those of the right ventricle (P<0.05). When comparing the FS of the 24 segments of the fetal left ventricle with that of the right ventricle, there was no statistical difference in segments 1-3 (P>0.05), but there was a statistical difference in segments 4-24 (P<0.05). The average Z values corresponding to SI and FS in the 24 segments were all within the normal range.
Fetal HQ technique can provide multiple parameters to quantitatively analyze the size, shape, and systolic function of the fetal heart, with reliable and feasible results, which provides a new and effective method for evaluating fetal heart function.
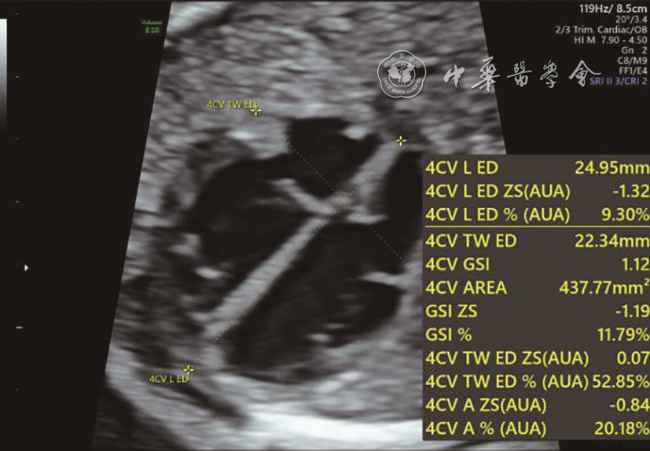
图1 四腔心舒张末期超声心动图。图中4CV-L-ED为四腔心舒张末期长径,即四腔心基底到心尖部心外膜间的距离;4CV-TW-ED为四腔心舒张末期横径,即心脏横向心外膜间最长距离;4CV-GSI为四腔心整体球形指数;4CV-AREA为四腔心面积 |
图5 胎儿心脏大小参数与孕龄的相关性分析散点图。图a为四腔心舒张末期横径、长径与孕龄的相关性分析散点图;图b为四腔心面积与孕龄的相关性分析散点图;图c为四腔心舒张末期横径、长径及四腔心面积相应的Z值与孕龄的相关性分析散点图注:4CV-TW-ED为四腔心舒张末期横径;4CV-L-ED为四腔心舒张末期长径;4CV-A-ED为四腔心舒张末期面积;GA为孕龄;ZS为Z值 |
表1 胎儿左心室与右心室心脏大小参数及收缩功能参数比较( |
| 参数 | 例数 | ED-A(mm²) | ED-L(mm) | GLS(%) | FAC(%) |
|---|---|---|---|---|---|
| LV | 215 | 1.29±0.04 | 1.66±0.03 | -22.16±8.95 | 43.16±12.40 |
| RV | 215 | 1.15±0.04 | 1.43±0.02 | -18.62±8.27 | 33.59±12.89 |
| t值 | -2.42 | 6.43 | -4.26 | 7.85 | |
| P值 | 0.016 | <0.001 | <0.001 | <0.001 |
注:ED-A为舒张末期面积;ED-L为舒张末期长径;GLS为整体球形指数;FAC为面积变化分数;LV为左心室;RV为右心室 |
图6 胎儿心脏球形指数与孕龄的相关性分析散点图。图a为胎儿心脏整体球形指数与孕龄的相关性分析散点图;图b为胎儿左、右心室第一节段球形指数与孕龄的相关性分析散点图注:4CV-GSI为四腔心整体球形指数;LV-SI-Segment 1为左心室第一节段球形指数;RV-SI-Segment 1为右心室第一节段球形指数;GA为孕龄 |
表2 胎儿左心室与右心室24节段SI比较( |
| 节段 | LV-SI | RV-SI | t值 | P值 |
|---|---|---|---|---|
| 基底段 | ||||
| 1 | 1.87±0.47 | 1.63±0.38 | 7.034 | <0.001 |
| 2 | 1.85±0.45 | 1.60±0.36 | 7.818 | <0.001 |
| 3 | 1.84±0.43 | 1.58±0.35 | 8.529 | <0.001 |
| 4 | 1.84±0.42 | 1.57±0.34 | 9.105 | <0.001 |
| 5 | 1.84±0.41 | 1.56±0.34 | 9.559 | <0.001 |
| 6 | 1.85±0.40 | 1.56±0.34 | 9.936 | <0.001 |
| 7 | 1.87±0.40 | 1.58±0.34 | 10.168 | <0.001 |
| 8 | 1.90±0.40 | 1.60±0.34 | 10.198 | <0.001 |
| 中间段 | ||||
| 9 | 1.93±0.40 | 1.63±0.35 | 9.980 | <0.001 |
| 10 | 1.96±0.40 | 1.66±0.36 | 9.531 | <0.001 |
| 11 | 1.99±0.41 | 1.71±0.38 | 8.959 | <0.001 |
| 12 | 2.03±0.42 | 1.76±0.39 | 8.222 | <0.001 |
| 13 | 2.08±0.44 | 1.82±0.41 | 7.415 | <0.001 |
| 14 | 2.14±0.46 | 1.90±0.43 | 6.556 | <0.001 |
| 15 | 2.20±0.49 | 1.99±0.45 | 5.574 | <0.001 |
| 16 | 2.27±0.51 | 2.09±0.48 | 4.339 | <0.001 |
| 心尖段 | ||||
| 17 | 2.34±0.52 | 2.22±0.51 | 2.665 | <0.001 |
| 18 | 2.39±0.52 | 2.37±0.53 | 0.423 | 0.673 |
| 19 | 2.48±0.52 | 2.58±0.57 | -2.108 | 0.036 |
| 20 | 2.65±0.55 | 2.89±0.65 | -4.443 | <0.001 |
| 21 | 2.98±0.63 | 3.40±0.80 | 7.034 | <0.001 |
| 22 | 3.68±0.79 | 4.32±1.08 | 7.818 | <0.001 |
| 23 | 5.24±1.15 | 6.28±1.65 | 8.529 | <0.001 |
| 24 | 10.18±2.26 | 12.33±3.35 | 9.105 | <0.001 |
注:SI为球形指数;LV-SI为左心室球形指数;RV-SI为右心室球形指数 |
图7 胎儿心脏收缩功能参数与孕龄的相关性分析散点图。图a为胎儿左、右心室面积变化分数与孕龄的相关性分析散点图;图b为胎儿左、右心室整体纵向应变与孕龄的相关性分析散点图;图c为胎儿左、右心室第一节段短轴缩短率与孕龄的相关性分析散点图注:LV-FAC为左心室面积变化分数;RV-FAC为右心室面积变化分数;LV-GLS左心室整体纵向应变;RV-GLS右心室整体纵向应变;LV-FS-Segment 1为左心室第一节段短轴缩短率;RV-FS-Segment 1为右心室第一节段短轴缩短率 |
表3 胎儿左心室与右心室24节段FS比较(%,n=215) |
| 节段 | 左心室FS( ±s) | 右心室FS[ ±s或M(P25,P75)] | 统计值 | P值 |
|---|---|---|---|---|
| 基底段 | ||||
| 1 | 14.98±11.62 | 15.58±11.30 | t=-0.536 | 0.592 |
| 2 | 16.50±10.96 | 16.30±10.36 | t=0.200 | 0.841 |
| 3 | 18.00±10.67 | 16.96±9.82 | t=1.056 | 0.291 |
| 4 | 19.54±10.65 | 17.54±9.59 | t=2.046 | 0.041 |
| 5 | 21.20±10.73 | 18.06±9.51 | t=3.215 | <0.001 |
| 6 | 23.04±10.84 | 18.50±9.50 | t=4.612 | <0.001 |
| 7 | 24.97±11.02 | 18.87±9.62 | t=6.114 | <0.001 |
| 中间段 | ||||
| 8 | 26.89±11.30 | 19.14±9.91 | t=7.556 | <0.001 |
| 9 | 28.65±11.61 | 19.30±10.33 | t=8.822 | <0.001 |
| 10 | 30.14±11.89 | 19.32±10.83 | t=9.863 | <0.001 |
| 11 | 31.39±12.14 | 19.26±11.41 | t=10.670 | <0.001 |
| 12 | 32.48±12.44 | 19.18±12.07 | t=11.251 | <0.001 |
| 13 | 33.51±12.77 | 19.15±12.75 | t=11.668 | <0.001 |
| 14 | 34.54±13.13 | 19.20±13.37 | t=12.001 | <0.001 |
| 15 | 35.59±13.50 | 19.26±13.99 | t=12.314 | <0.001 |
| 16 | 36.59±13.81 | 19.18±14.62 | t=12.690 | <0.001 |
| 心尖段 | ||||
| 17 | 37.49±14.02 | 18.41(8.65,3.09) | Z=-10.377 | <0.001 |
| 18 | 38.21±14.13 | 18.28(6.93,29.03) | Z=-10.508 | <0.001 |
| 19 | 38.71±14.32 | 16.56(5.49,27.54) | Z=-10.636 | <0.001 |
| 20 | 39.01±14.71 | 16.02(4.62,27.19) | Z=-10.676 | <0.001 |
| 21 | 39.17±15.20 | 14.36(3.24,27.36) | Z=-10.661 | <0.001 |
| 22 | 39.26±15.64 | 14.37(0.90,26.11) | Z=-10.618 | <0.001 |
| 23 | 39.31±15.95 | 13.79(-1.29,26.33) | Z=-10.567 | <0.001 |
| 24 | 39.33±16.14 | 13.49(-1.03,26.75) | Z=-10.526 | <0.001 |
注:FS为短轴缩短率 |
| [1] |
林深, 罗舒榆, 李振洲, 等. 超声新技术评价胎儿心功能的研究进展 [J/CD].中国产前诊断杂志(电子版), 2018, 10(2): 28-31.
|
| [2] |
吴雪娇, 王倩, 铁红霞. 影像技术评价胎儿心功能的研究进展 [J]. 影像研究与医学应用, 2022, 6(3): 1-3.
|
| [3] |
|
| [4] |
李炎菲海, 王海蕊, 谭芳, 等. 运用胎儿心脏定量分析技术评估胎儿心脏形状的初步研究 [J]. 中国超声医学杂志, 2021, 37(9): 1032-1035.
|
| [5] |
左镕宇. 二维斑点追踪成像技术对胎儿先天性心脏病心功能的评估 [D].昆明: 昆明医科大学, 2019.
|
| [6] |
|
| [7] |
|
| [8] |
|
| [9] |
|
| [10] |
邬亮. 组织多普勒成像评价高血压患者左心室重构对舒张功能的影响 [D]. 山东: 青岛大学, 2015.
|
| [11] |
陈思楷, 周青, 宋宏宁, 等. 多模态医学影像融合技术3D打印心脏模型方法学及精准度研究 [J]. 中华超声影像学杂志, 2018, 27(11): 924-930.
|
| [12] |
李文纲, 赵博文, 潘美, 等. 胎儿心脏定量分析技术对中晚孕胎儿心室24节段球形指数的初步研究 [J]. 中华超声影像学杂志, 2020, 29(7): 586-591.
|
| [13] |
|
| [14] |
|
| [15] |
|
| [16] |
|
| [17] |
|
/
| 〈 |
|
〉 |


