
2023 , Vol. 20 >Issue 06: 622 - 630
DOI: https://doi.org/10.3877/cma.j.issn.1672-6448.2023.06.009
血清学指标联合常规超声及超声造影评分诊断原发性干燥综合征的临床价值
Copy editor: 汪荣
收稿日期: 2022-09-30
网络出版日期: 2023-10-31
基金资助
浙江省医药卫生科技计划项目面上项目(2021KY789)
版权
Clinical value of serological indicators combined with conventional ultrasound and contrast-enhanced ultrasound scoring in diagnosis of primary Sjögren's syndrome
Received date: 2022-09-30
Online published: 2023-10-31
Copyright
探讨血清学指标联合常规超声及超声造影评分在原发性干燥综合征(pSS)诊断中的临床价值。
前瞻性选取2017年6月至2018年12月在温州医科大学附属第一医院就诊的161例可疑pSS患者为研究对象,记录患者基线资料,完善实验室检查、相关的诊断实验及唇腺病理检查。将入组的161例患者分为pSS组83例与非pSS组78例。对所有患者腮腺及颌下腺行涎腺超声检查(SGU)后按0~4分评分系统评分,并进行超声造影(CEUS)检查,获得造影参数。应用Logistic回归分析,对参数进行筛选,构建超声造影评分方程。将血清学指标联合超声总评分、超声造影评分、超声总评分及超声造影评分、唇腺病理分级分别构建4种pSS诊断模型,应用ROC曲线评估4种模型对pSS的诊断效能,应用 DeLong统计方法比较ROC曲线下面积(AUC),并计算敏感度、特异度、阳性预测值、阴性预测值及似然比。
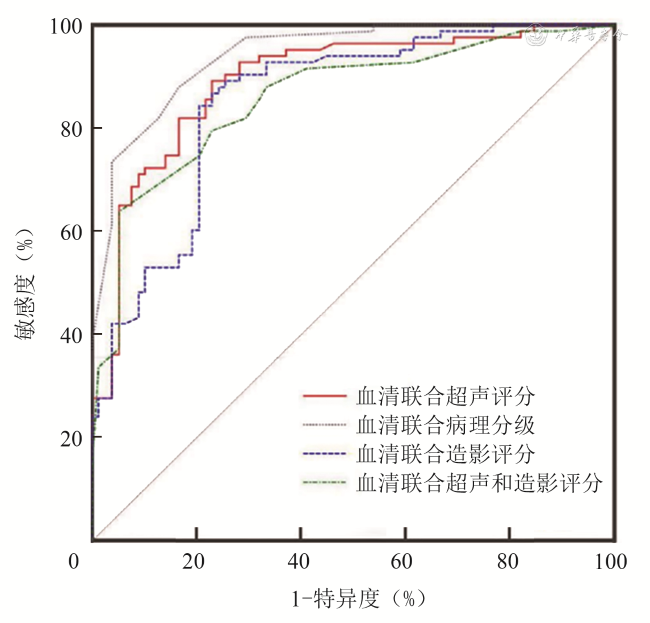
与非pSS组相比,pSS组超声总评分的中位数较高(8 vs 4,P<0.001),pSS组的颌下腺造影参数曲线梯度(Grad)的中位数(1.36 vs 1.94,P<0.001),时间-强度曲线下面积(Area)的中位数(876.49 vs 954.27,P=0.003),腺体峰值强度(PI)的中位数(-51.20 dB vs -49.20 dB,P=0.001),腺体强度差值(ID)的中位数(15.90 dB vs17.80 dB,P=0.003)均较小,pSS组颌下腺造影剂达峰时间(TTP)的中位数大于非pSS组(10.01 s vs 9.10 s,P=0.046)。构建超声造影评分方程为:y=7.760-1.534×颌下腺Grad。4种pSS诊断模型的ROC比较结果显示:血清联合超声总评分诊断pSS的AUC为0.860;血清联合超声造影评分的AUC为0.854;血清联合病理分级的AUC为0.941;血清联合超声造影评分及超声总评分的AUC为0.892。血清联合超声造影评分及超声总评分模型的诊断效能优于血清联合超声总评分模型及血清联合超声造影评分模型,差异存在统计学意义(P=0.024、0.015),而与血清联合病理分级模型相比,两者差异无统计学意义(P=0.066)。
血清学指标联合常规超声及超声造影评分可以提高对pSS的诊断效能,且与血清学指标联合唇腺病理的诊断效能相当,其在一定程度上可避免过度的有创检查。
蒋佳纯 , 王晓冰 , 陈培荣 , 许世豪 . 血清学指标联合常规超声及超声造影评分诊断原发性干燥综合征的临床价值[J]. 中华医学超声杂志(电子版), 2023 , 20(06) : 622 -630 . DOI: 10.3877/cma.j.issn.1672-6448.2023.06.009
To evaluate the clinical value of serological indicators combined with conventional ultrasound and contrast-enhanced ultrasound scoring in the diagnosis of primary Sjögren's syndrome syndrome (pSS).
A total of 161 suspected pSS patients who visited the First Affiliated Hospital of Wenzhou Medical University from June 2017 to December 2018 were prospectively selected as the research subjects. Their baseline data were recorded, and relevant laboratory tests, diagnostic tests, and labial gland pathological examinations were performed. The enrolled patients were divided into either a pSS group (83 cases) or a non-pSS group (78 cases). The parotid gland and submaxillary gland of all patients were scored according to a 4-point scoring system after salivary gland ultrasonographic examination, and contrast-enhanced ultrasound examination was performed to obtain contrast parameters. Logistic regression analysis was performed to screen parameters and construct a contrast-enhanced ultrasound contrast scoring equation. Four pSS diagnostic models were constructed by combining serological indicators with total ultrasound score, contrast-enhanced ultrasound score, and labial gland pathological grade. The diagnostic efficacy of the four models for pSS was evaluated by receiver operating characteristic (ROC) curve analysis. The area under the ROC curve (AUROC) of the models was compared by DeLong test, and their sensitivity, specificity, positive predictive value, negative predictive value, and likelihood ratio were calculated.
Compared with the non-pSS group, the median ultrasound total score was higher (8 vs 4, P<0.001), the median gradient of submandibular gland imaging parameters (Grad) (1.36 vs 1.94, P<0.001), the median area under the time intensity curve (Area) (876.49 vs 954.27, P=0.003), the median peak gland intensity (PI) (-51.20 dB vs -49.20 dB, P=0.001), and the median difference in gland intensity (ID) was smaller (15.90 dB vs 17.80 dB, P=0.003), and the median time to peak (TTP) of submandibular gland contrast agent was greater in the pSS group (10.01 s vs 9.10 s, P=0.046). A scoring equation for contrast-enhanced ultrasound was constructed as follows: y=7.760-1.534 × submandibular gland Grad. ROC curve analysis of four pSS diagnostic models showed that the AUROC of serological indicators combined with total ultrasound score for the diagnosis of pSS was 0.860; the AUROC of serological indicators combined with contrast-enhanced ultrasound, score, serological indicators combined with pathological grade, and serological indicators combined with contrast-enhanced ultrasound score and total ultrasound score was 0.854, 0.941, and 0.892, respectively. The diagnostic efficacy of serological indicators combined with contrast-enhanced ultrasound score and ultrasound total score was significantly superior to that of serological indicators combined with contrast-enhanced ultrasound score or ultrasound total score (P=0.024 and 0.015, respectively). However, there was no significant difference in diagnostic efficacy between serological indicators combined with pathological grade and serological indicators combined with contrast-enhanced ultrasound score and ultrasound score total score (P=0.066).
The combination of serological indicators, ultrasound score, and contrast-enhanced ultrasound score can improve the diagnostic efficacy for pSS, and its diagnostic efficacy is comparable to that of serological indicators combined with labial gland pathology. Such diagnostic model can avoid excessive invasive examination to a certain extent.
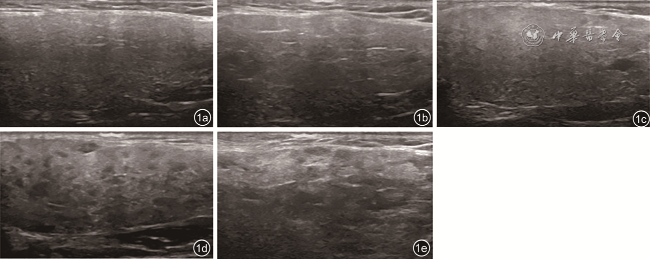
图1 腺体超声评分图像。图a为腺体超声评分0分(正常腺体,内部回声纤细、均匀,强度与甲状腺回声相似);图b为腺体超声评分1分(腺体轻度增大,回声轻度减低,分布欠均匀,可见少许线样高回声);图c为腺体超声评分2分(腺体与周边组织分界欠清晰,腺体内部回声不均匀较为显著,可见低回声或无回声区呈弥漫性分布,大部分低回声或无回声区的最大直径<2 mm);图d为腺体超声评分3分(低回声或无回声区扩大并相互融合,大部分低回声或无回声区最大直径>2 mm,线样高回声分布杂乱);图e为腺体超声评分4分(腺体一般缩小或正常,边缘不平整,内部回声与周围脂肪组织相似且分界模糊不清,内部回声杂乱呈结节样) |
表1 非pSS组与pSS组临床基线资料组间比较 |
| 资料 | 非pSS组(n=78) | pSS组(n=83) | 统计值 | P值 |
|---|---|---|---|---|
| 性别[例(%)] | χ2=9.10 | 0.003 | ||
| 女 | 62(79.49) | 79(95.18) | ||
| 男 | 16(20.51) | 4(4.82) | ||
| 年龄(岁, ±s) | 47.87±14.11 | 47.96±11.95 | t=0.05 | 0.964 |
| 身高(m, ±s) | 1.63±0.07 | 1.59±0.05 | t=4.45 | <0.001 |
| 体重(kg, ±s) | 60.53±8.54 | 55.04±7.76 | t=4.27 | <0.001 |
| BMI(kg/m2, ±s) | 22.66±2.89 | 21.75±2.90 | t=1.99 | 0.048 |
| 收缩压(mmHg, ±s) | 118.51±17.84 | 118.40±19.52 | t=0.04 | 0.969 |
| 舒张压(mmHg, ±s) | 77.69±9.86 | 76.73±10.61 | t=0.59 | 0.555 |
| IgG[g/L,M(P25,P75)] | 14.80(12.90,17.90) | 17.40(13.50,21.30) | Z=3.19 | 0.001 |
| IgM[g/L,M(P25,P75)] | 0.99(0.82,1.44) | 1.26(0.96,1.71) | Z=1.96 | 0.049 |
| IgA[g/L,M(P25,P75)] | 2.87(1.90,3.65) | 2.90(2.25,3.91) | Z=0.85 | 0.398 |
| 补体C3[g/L,M(P25,P75)] | 1.02(0.85,1.26) | 0.99(0.90,1.15) | Z=0.55 | 0.586 |
| 补体C4[g/L,M(P25,P75)] | 0.21(0.17,0.26) | 0.19(0.16,0.26) | Z=1.42 | 0.156 |
| 抗SSA抗体[例(%)] | χ2=76.89 | <0.001 | ||
| 阴性 | 68(87.18) | 15(18.07) | ||
| 阳性 | 10(12.82) | 68(81.93) | ||
| 抗SSB抗体[例(%)] | χ2=24.45 | <0.001 | ||
| 阴性 | 76(97.44) | 56(67.47) | ||
| 阳性 | 2(2.56) | 27(32.53) | ||
| 抗Ro52抗体[例(%)] | χ2=28.50 | <0.001 | ||
| 阴性 | 64(82.05) | 34(40.96) | ||
| 阳性 | 14(17.95) | 49(59.04) | ||
| 血清学指标[例(%)] | χ2=71.03 | <0.001 | ||
| 阴性 | 64(82.05) | 13(15.66) | ||
| 阳性 | 14(17.95) | 70(84.34) | ||
| Chisholm分级[例(%)] | Z=8.80 | <0.001 | ||
| 0 | 6(7.69) | 1(1.20) | ||
| 1 | 40(51.28) | 8(9.64) | ||
| 2 | 26(33.33) | 8(9.64) | ||
| 3 | 6(7.69) | 24(28.92) | ||
| 4 | 0 | 42(50.60) |
注:pSS为原发性干燥综合征;BMI为体质量指数;IgG、IgM、IgA为免疫球蛋白;抗SSA抗体、抗SSB抗体、抗Ro52抗体为血清自身免疫性抗体 |
表2 非pSS组与pSS组超声影像学参数组间比较[M(P25,P75)] |
| 超声评分及超声造影参数 | 非pSS组(n=78) | pSS组(n=83) | Z值 | P值 |
|---|---|---|---|---|
| 超声评分 | ||||
| 腮腺超声评分 | 2.00(2.00,2.00) | 4.00(2.00,6.00) | 5.63 | <0.001 |
| 颌下腺超声评分 | 2.00(2.00,4.00) | 4.00(2.00,6.00) | 4.92 | <0.001 |
| 超声总评分 | 4.00(4.00,6.00) | 8.00(4.00,12.00) | 5.45 | <0.001 |
| 腮腺超声造影 | ||||
| Grad | 1.40(1.09,1.80) | 1.56(0.99,1.92) | 0.33 | 0.740 |
| Area | 644.72(554.10,813.47) | 690.34(542.40,845.65) | 0.21 | 0.834 |
| AT(s) | 8.64(7.73,10.37) | 8.28(6.82,10.37) | 0.86 | 0.392 |
| TTP(s) | 10.01(7.55,11.64) | 9.19(7.64,11.64) | 0.28 | 0.781 |
| PT(s) | 19.74(15.92,21.92) | 17.65(15.65,21.29) | 1.11 | 0.267 |
| AI(dB) | -66.40(-67.40,-65.00) | -67.00(-68.40,-66.20) | 2.47 | 0.054 |
| PI(dB, ±s) | -52.52±3.33 | -53.38±3.47 | 1.74 | 0.081 |
| ID(dB, ±s) | 13.95±3.15 | 13.68±3.52 | 0.06 | 0.954 |
| 颌下腺超声造影 | ||||
| Grad | 1.94(1.62,2.72) | 1.36(1.00,1.99) | 5.65 | <0.001 |
| Area | 954.27(842.83,1109.11) | 876.49(707.10,1001.59) | 2.96 | 0.003 |
| AT(s) | 8.55(7.00,10.46) | 8.73(6.91,11.01) | 0.76 | 0.447 |
| TTP(s) | 9.10(7.73,11.55) | 10.01(8.19,12.46) | 2.00 | 0.046 |
| PT(s) | 17.74(15.01,20.74) | 18.56(16.37,23.10) | 1.72 | 0.086 |
| AI(dB) | -67.30(-67.90,-65.30) | -67.50(-68.70,-66.00) | 1.36 | 0.174 |
| PI(dB) | -49.20(-51.30,-46.80) | -51.20(-54.00,-48.30) | 3.37 | 0.001 |
| ID(dB) | 17.80(16.00,19.80) | 15.90(13.50,18.50) | 2.93 | 0.003 |
注:pSS为原发性干燥综合征;Grad为时间-强度曲线梯度;Area为时间-强度曲线下面积;AT为造影剂到达时间;TTP为造影剂达峰时间;PT为造影剂峰值时间;AI为腺体基础强度;PI为腺体峰值强度;ID为腺体强度差值 |
表3 超声造影参数多因素Logistic回归分析 |
| 参数 | β值 | OR值 | 95%CI | P值 |
|---|---|---|---|---|
| 颌下腺Grad | -1.534 | 0.216 | 0.090~0.515 | 0.001 |
| 颌下腺Area | -0.002 | 0.999 | 0.994~1.001 | 0.176 |
| 颌下腺TTP(s) | 0.064 | 1.066 | 0.863~1.316 | 0.554 |
| 颌下腺PT(s) | -0.057 | 0.945 | 0.855·1.044 | 0.264 |
| 颌下腺PI(dB) | -0.108 | 0.897 | 0.766~1.052 | 0.181 |
| 颌下腺ID(dB) | 0.184 | 1.202 | 0.919~1.572 | 0.179 |
| 常量 | 7.760 |
注:Grad为TIC曲线梯度;Area为TIC曲线下面积;TTP为造影剂达峰时间;PT为造影剂峰值时间;PI为腺体峰值强度;ID为腺体强度差值 |
表4 血清学指标联合超声造影评分的Logistic回归分析 |
| 参数 | β值 | OR值 | 95%CI | P值 |
|---|---|---|---|---|
| 血清学指标 | 2.234 | 9.335 | 4.183~20.835 | <0.001 |
| 超声造影评分 | 0.875 | 2.398 | 1.564~3.679 | <0.001 |
| 常量 | -5.548 |
表5 血清学指标联合超声总评分的Logistic回归分析 |
| 参数 | β值 | OR值 | 95%CI | P值 |
|---|---|---|---|---|
| 血清学指标 | 2.415 | 11.185 | 4.956~25.243 | <0.001 |
| 超声总评分 | 0.230 | 1.259 | 1.132~1.400 | <0.001 |
| 常量 | -2.765 |
表6 血清学指标联合唇腺病理分级的Logistic回归分析 |
| 参数 | β值 | OR值 | 95%CI | P值 |
|---|---|---|---|---|
| 血清学指标 | 2.628 | 13.847 | 4.652~41.212 | <0.001 |
| 病理Chisholm分级 | 1.732 | 5.650 | 3.281~9.732 | <0.001 |
| 常量 | -5.262 |
表7 血清学指标联合超声总评分及超声造影评分的Logistic回归分析 |
| 参数 | β值 | OR值 | 95%CI | P值 |
|---|---|---|---|---|
| 血清学指标 | 2.201 | 9.038 | 3.803~21.481 | <0.001 |
| 超声总评分 | 0.227 | 1.255 | 1.114~1.413 | <0.001 |
| 超声造影评分 | 0.803 | 2.231 | 1.423~3.499 | <0.001 |
| 常量 | -6.611 |
表8 4种模型对pSS诊断效能的比较 |
| 模型 | 敏感度(%) | 特异度(%) | 阳性似然比 | 阴性似然比 | 阳性预测值(%) | 阴性预测值(%) | 曲线下面积(95%CI) | Youden |
|---|---|---|---|---|---|---|---|---|
| 血清联合超声总评分 | 63.86 | 94.87 | 12.45 | 0.38 | 93.00 | 71.20 | 0.860(0.797~0.910) | 0.5873 |
| 血清联合超声造影评分 | 84.34 | 79.49 | 4.11 | 0.20 | 81.40 | 82.70 | 0.854(0.789~0.904) | 0.6382 |
| 血清联合病理分级 | 87.95 | 83.33 | 5.28 | 0.14 | 94.90 | 86.70 | 0.941(0.893~0.972) | 0.7129 |
| 血清联合超声总评分及超声造影评分 | 89.16 | 76.92 | 3.86 | 0.14 | 80.40 | 87.00 | 0.892(0.834~0.935) | 0.6608 |
注:pSS为原发性干燥综合征 |
| [1] |
|
| [2] |
|
| [3] |
楼蒙妮, 王莎莎, 李延萍, 等. 唇腺活检在干燥综合征中的价值[J]. 世界最新医学信息文摘, 2021, 21(32): 82-184.
|
| [4] |
|
| [5] |
|
| [6] |
缪伎玄, 张迎春, 薛勤, 等. 原发性干燥综合征患者涎腺超声评分与唇腺病理分级的相关性研究[J]. 中华风湿病学杂志, 2018, 22(10): 680-683.
|
| [7] |
|
| [8] |
|
| [9] |
徐钟慧, 王鸿琳, 杜德顺, 等. 超声评分法诊断干燥综合征涎腺病变[J]. 中华超声影像学杂志, 2010, 19(11): 977-980.
|
| [10] |
|
| [11] |
何垚, 杨龙, 袁建军, 等. 原发性肝癌超声造影血流灌注参数与肿瘤分化程度及微血管生成的关系[J]. 中国医学影像技术, 2021, 37(8): 1177-1181.
|
| [12] |
|
| [13] |
|
| [14] |
|
| [15] |
|
| [16] |
邹芳, 王爽. 乳腺癌超声造影联合BI-RADS分级与病理检查结果对比分析[J]. 影像科学与光化学, 2021, 39(4): 620-623.
|
| [17] |
|
| [18] |
徐钟慧, 王鸿琳, 杜德顺, 等. 多普勒超声观察干燥综合征腮腺病变的血流动力学特征[J]. 中国医学影像技术, 2010, 26(9): 1674-1677.
|
| [19] |
陈嘉利, 吕宇基, 黎品健, 等. 原发性干燥综合征患者体内维生素D3水平与其免疫功能的相关性研究[J]. 中国实用医药, 2017, 12(11): 65-67.
|
| [20] |
刘荷江, 常娥, 郭敏. 自身抗体检测诊断原发性干燥综合征的临床应用价值分析[J]. 内科, 2018, 13(3): 329-332.
|
/
| 〈 |
|
〉 |

