
2023 , Vol. 20 >Issue 11: 1193 - 1198
DOI: https://doi.org/10.3877/cma.j.issn.2096-1537.2023.11.014
经直肠剪切波弹性成像对存在下尿路症状的前列腺病变良恶性的鉴别诊断价值及其影响因素分析
Copy editor: 吴春凤
收稿日期: 2022-10-18
网络出版日期: 2024-01-15
基金资助
甘肃省科技计划项目(21JR7RE901)
版权
Value of transrectal shear-wave elastography in differential diagnosis of benign and malignant prostate lesions with lower urinary tract symptoms and factors related to severity of such symptoms
Received date: 2022-10-18
Online published: 2024-01-15
Copyright
探讨经直肠剪切波弹性成像(SWE)对前列腺癌和前列腺增生的鉴别诊断价值及下尿路症状严重程度的相关影响因素。
回顾性收集106例自2021年11月至2023年1月天水市第一人民医院诊断为前列腺癌或前列腺增生伴有下尿路症状并行经直肠SWE检查患者的临床资料,其中前列腺癌组33例,前列腺增生组73例。收集所有患者的年龄、总前列腺体积(TPV)、最大杨氏模量值(Emax)、平均杨氏模量值(Emean)、最小杨氏模量值(Emin)、总前列腺特异性抗原(tPSA)、游离前列腺特异性抗原(fPSA)与国际前列腺症状评分(IPSS)等临床数据,采用独立样本t检验比较2组间杨氏模量值的差异,绘制受试者操作特征(ROC)曲线分析杨氏模量值诊断前列腺癌和前列腺增生的诊断效能,并应用Spearman秩相关分析IPSS与年龄、TPV、Emax、Emean、Emin、tPSA、fPSA的相关性。
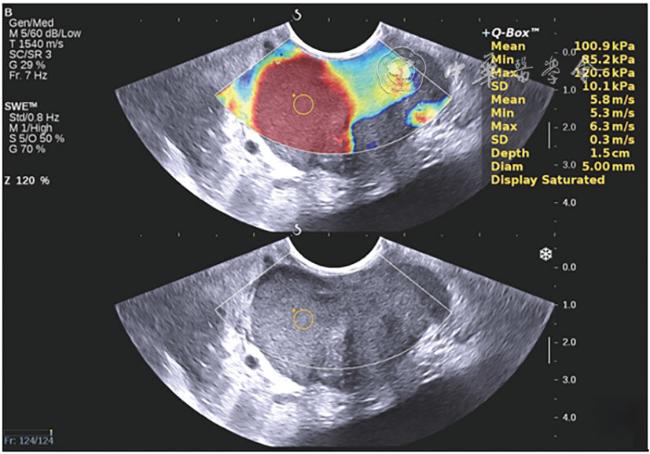
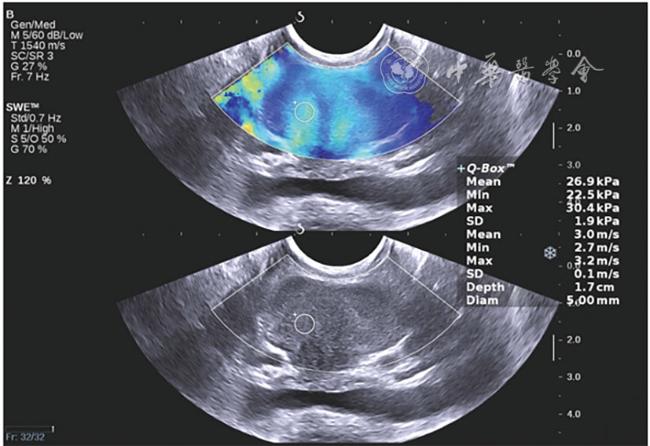
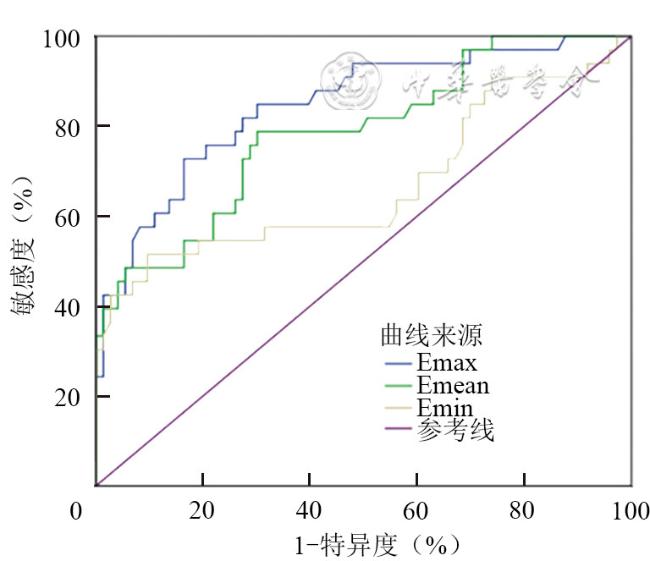
前列腺癌组Emax值、Emean值、Emin值大于前列腺增生组[(86.63±21.63)kPa vs (59.60±15.52)kPa;(71.31±23.71)kPa vs (48.37±12.87)kPa;(58.69±26.22)kPa vs(41.34±12.66)kPa],差异均具有统计学意义(t=6.463、5.222、3.616,P<0.001、<0.001、=0.001)。ROC曲线分析显示,Emax、Emean及Emin的曲线下面积分别为0.846、0.785、0.670。以曲线下面积>0.7为具有诊断效能的标准,计算Youden指数,获取Emax的最佳截断值为76.25 kPa,敏感度、特异度为72.7%、83.6%;Emean的最佳截断值为54.3 kPa,敏感度、特异度为78.8%,69.9%。年龄(r=0.332,P=0.001)、TPV(r=0.341,P<0.001)、Emax(r=0.282,P=0.003)、Emean(r=0.308,P=0.001)和Emin(r=0.431,P<0.001)与IPSS呈一定正相关。
经直肠SWE对前列腺癌与前列腺增生的鉴别诊断有一定的临床价值。此外下尿路症状的严重程度与年龄、前列腺体积与硬度有一定的相关性。
李辉 , 尉维录 , 吴茂林 . 经直肠剪切波弹性成像对存在下尿路症状的前列腺病变良恶性的鉴别诊断价值及其影响因素分析[J]. 中华医学超声杂志(电子版), 2023 , 20(11) : 1193 -1198 . DOI: 10.3877/cma.j.issn.2096-1537.2023.11.014
To assess the value of transrectal shear wave elastography (SWE) in the differential diagnosis of prostate cancer and prostatic hyperplasia and identify factors related to the severity of lower urinary tract symptoms.
The clinical data of 106 patients diagnosed with prostate cancer or prostatic hyperplasia accompanied by lower urinary tract symptoms from November 2021 to January 2023 were retrospectively collected from the First People's Hospital of Tianshui, including 33 patients with prostate cancer and 73 patients with prostate hyperplasia. Clinical data analyzed mainly included age,total prostate volume (TPV), Emax, Emean, Emin, total prostate specific antigen (tPSA), free prostate specific antigen (fPSA), and international prostate symptom score (IPSS). The difference of Young's modulus between the two groups was compared by t-test. Receiver operating characteristic (ROC) curve analysis was performed to assess the diagnostic efficacy for prostate cancer and prostatic hyperplasia. The correlation between IPSS and age, TPV, Emax, Emean, Emin, tPSA, and fPSA was analyzed by Spearman rank correlation.
The Emax, Emean, and Emin in the prostate cancer group were significantly higher than those of the prostate hyperplasia group [(86.63±21.63) kPa vs (59.60±15.52) kPa, t=6.463, P<0.001; (71.31±23.71) kPa vs (48.37±12.87) kPa, t=5.222, P<0.001; (58.69±26.22) kPa vs (41.34±12.66) kPa, t=3.616, P=0.001]. ROC curve analysis showed that the area under the curve values of Emax, Emean, and Emin for the differential diagnosis of the two disease entities were 0.846, 0.785, and 0.670, respectively. AUC>0.7 was taken as the criterion of diagnostic efficacy, and the maximum Youden index was calculated. The optimal cut-off value of Emax was 76.25 kPa, and the sensitivity and specificity were 72.7% and 83.6%, respectively. The optimal cut-off value of Emean was 54.3 kPa, and the sensitivity and specificity were 78.8% and 69.9%, respectively. Age (r=0.332, P=0.001), TPV (r=0.341, P<0.001), Emax (r=0.282, P=0.003), Emean (r=0.308, P=0.001), and Emin (r=0.431, P<0.001) were correlated with IPSS.
Transrectal shear wave elastography has appreciated clinical value in the differential diagnosis of prostate cancer and prostatic hyperplasia. The severity of lower urinary tract symptoms is associated with age, prostate volume, and prostate stiffiness.
 表示,采用独立样本t检验比较组间差异性;TPV、IPSS、tPSA和fPSA为不符合正态分布的计量资料,采用M(QR)表示,采用非参数检验比较组间差异。绘制杨氏模量值诊断前列腺病灶良恶性的受试者操作特征(receiver operating characteristic,ROC)曲线并计算曲线下面积(area under the curve,AUC)衡量其鉴别诊断能力,以AUC>0.7为具有诊断效能的标准[5],通过计算最大Youden指数获取诊断截断值,并计算相应的敏感度和特异度。采用Spearman相关分析IPSS与年龄、TPV、Emax、Emean、Emin、tPSA及fPSA之间的相关性,计算Spearman相关系数(r)。P<0.05为差异具有统计学意义。
表1 存在下尿路症状患者临床资料比较 |
| 组别 | 例数 | 年龄(岁, ) ) | TPV[ml,M(QR)] | IPSS评分[分,M(QR)] | tPSA[ng/ml,M(QR)] | fPSA[ng/ml,M(QR)] |
|---|---|---|---|---|---|---|
| 前列腺癌组 | 33 | 72.85±7.74 | 43.39(34.80,71.76) | 10.00(7.00,17.00) | 74.67(25.00,149.20) | 7.26(3.93,31.63) |
| 前列腺增生组 | 73 | 69.32±7.09 | 64.52(45.57,87.81) | 11.00(8.50,15.00) | 5.28(2.36,9.33) | 0.92(0.47,1.62) |
| 统计值 | t=2.308 | Z=2.579 | Z=0.045 | Z=7.502 | Z=7.250 | |
| P值 | 0.023 | 0.010 | 0.964 | <0.001 | <0.001 |
注:TPV为总前列腺体积,IPSS为国际前列腺症状评分,tPSA为总前列腺特异性抗原,fPSA为游离前列腺特异性抗原 |
表2 2组存在下尿路症状患者杨氏模量值比较(kPa, |
| 组别 | 例数 | Emax值 | Emean值 | Emin值 |
|---|---|---|---|---|
| 前列腺癌组 | 33 | 86.63±21.63 | 71.31±23.71 | 58.69±26.22 |
| 前列腺增生组 | 73 | 59.60±15.52 | 48.37±12.87 | 41.34±12.66 |
| t值 | 6.463 | 5.222 | 3.616 | |
| P值 | <0.001 | <0.001 | 0.001 |
注:Emax为最大杨氏模量值;Emean为平均杨氏模量值;Emin为最小杨氏模量值 |
| 1 |
|
| 2 |
|
| 3 |
|
| 4 |
|
| 5 |
付宜永. 剪切波弹性成像对前列腺良恶性疾病的诊断价值 [D]. 唐山: 华北理工大学, 2019.
|
| 6 |
|
| 7 |
|
| 8 |
|
| 9 |
|
| 10 |
|
| 11 |
|
| 12 |
|
| 13 |
|
| 14 |
|
| 15 |
|
| 16 |
|
| 17 |
|
| 18 |
|
| 19 |
张耀仁, 艾红, 姬永浩, 等. 超声弹性成像组织弥散定量分析在前列腺良恶性病变中的诊断效果 [J]. 长春中医药大学学报, 2020, 36(5): 1002-1005.
|
| 20 |
梁蕾, 孙铮, 孙亚, 等. 经直肠超声剪切波弹性成像在鉴别前列腺外周带良恶性病变中的应用 [J]. 中国超声医学杂志, 2021, 37(9): 1049-1052.
|
/
| 〈 |
|
〉 |
 )
)