
2023 , Vol. 20 >Issue 12: 1223 - 1230
DOI: https://doi.org/10.3877/cma.j.issn.1672-6448.2023.12.001
斑点追踪成像和组织多普勒同步成像对不同起搏模式下左心室心肌同步性的评估
Copy editor: 汪荣
收稿日期: 2022-10-17
网络出版日期: 2024-03-05
基金资助
四川省自然基金(2022NSFSC0662)
版权
Evaluation of left ventricular myocardial synchrony under different pacing modes by speckle tracking imaging and tissue Doppler synchronous imaging
Received date: 2022-10-17
Online published: 2024-03-05
Copyright
应用二维斑点追踪成像和组织多普勒同步成像(TSI)技术探讨右心双腔室间隔起搏(RVSP)与希浦系统起搏(HPSP)模式下患者左心室心肌同步性。
前瞻性选取2020年2月至2021年9月于四川省人民医院接受房室全能型心脏起搏器植入的患者43例,按照起搏器植入方式不同将其分为RVSP组20例,HPSP组23例。同期选取40例志愿者为对照组。获取左心室节段应变达峰时间、应变达峰时间离散度(PSD)及左心室心肌做功等参数值。对二维斑点追踪评估的左心室17节段应变达峰时间、组织多普勒TSI评估的左心室12节段应变达峰时间及心肌做功参数和四维应变参数进行组间比较分析。
组织多普勒TSI模式:与对照组比较,HPSP组、RVSP组12(12/12)个节段应变达峰时间均增大(P均<0.05)。HPSP组与RVSP组比较,4(4/12)个节段差异存在统计学意义,基底前壁、中段前间隔、中段间隔和中段后壁应变达峰时间RVSP组大于HPSP组(P均<0.05)。二维斑点追踪模式:与对照组相比,HPSP组和(或)RVSP组13(13/17)个节段应变达峰时间均增大(P均<0.05)。HPSP组与RVSP组相比,11(11/17)个节段差异存在统计学意义,其中7个节段HPSP组的应变达峰时间大于RVSP组(P均<0.05)。同对照组相比,左心室心肌长轴应变、左心室整体心肌做功效率在RVSP组明显减低(P均<0.05),而HPSP组与正常对照组比较差异无统计学意义(P均>0.05)。PSD在对照组、HPSP组和RVSP组逐渐递增(P<0.05)。
在起搏器植入后6个月至1年的短期随访过程中,HPSP可以使左心室心肌更加协调、高效做功,左心室同步性优于RVSP。与组织多普勒技术相比,二维斑点追踪技术能够同时评估左心室心尖各节段心肌同步参数且不受角度依赖,相对更具优势。
孟庆国 , 唐艺加 , 王斯佳 , 周杰 , 冯天航 , 刘学兵 , 舒庆兰 , 邓燕 , 尹立雪 , 李春梅 . 斑点追踪成像和组织多普勒同步成像对不同起搏模式下左心室心肌同步性的评估[J]. 中华医学超声杂志(电子版), 2023 , 20(12) : 1223 -1230 . DOI: 10.3877/cma.j.issn.1672-6448.2023.12.001
To investigate the advantages and disadvantages of left ventricular synchrony in patients with right ventricular double-chamber septal pacing (RVSP) and His-Purkinje system pacing (HPSP) using two-dimensional speckle tracking imaging and tissue synchrony imaging (TSI) techniques.
Forty-three patients who underwent atrioventricular universal pacemaker implantation at Sichuan Provincial People's Hospital from February 2020 to September 2021 were prospectively divided into an RVSP group (n=20) and an HPSP group (n=23). In the same period, 40 volunteers were selected as a control group. The dynamic two-dimensional grayscale and TSI images of the standard apical tri-plane section of each group were collected for three consecutive cardiac cycles, and the time to peak strain, peak strain dispersion (PSD), and the work of each segment of the left ventricle in the same cardiac cycle were obtained offline. The above parameters were analyzed and compared by taking the average of three cardiac cycles.
With regard to TSI pattern, compared with the control group, the time to peak strain of 12 (12 /12) segments in both the HPSP group and RVSP group were increased (P<0.05 for all). There was a significant difference in the time to peak strain of 4 (4/12) segments between the HPSP group and RVSP group: The time to peak strain of the anterior basal wall, anterior septum of middle segment, middle septum, and posterior wall of middle segment in the RVSP group was longer than that in the HPSP group (P<0.05 for all). Two-dimensional speckle tracking imaging showed that compared with the control group, the time to peak strain of 13 segments in the HPSP group and/or RVSP group was increased (P<0.05). There was a significant difference in the time to peak strain of 11 (11/17) segments between the HPSP group and RVSP group, and the time to peak strain of 7 segments in the HPSP group was longer than that in the RVSP group (P<0.05 for all). Compared with the control group, the long-axis strain of the left ventricle and the overall myocardial work efficiency of the left ventricle decreased significantly in the RVSP group (P<0.05 for both), but there was no significant difference between the HPSP group and the normal control group (P>0.05 for both). PSD increased gradually and sequentially in the control group, HPSP group, and RVSP group (P<0.05).
During the short-term follow-up from 6 months to 1 year after pacemaker implantation, HPSP can make the left ventricular myocardium more coordinated and efficient, and the left ventricular synchronization is better than that with RVSP. Compared with TSI, two-dimensional speckle tracking technique can also simultaneously evaluate myocardial synchronization parameters of each segment of the left ventricular apex without angle dependence, which provides more comprehensive information for clinicians, suggesting that this technique has more advantages in evaluating synchronization.
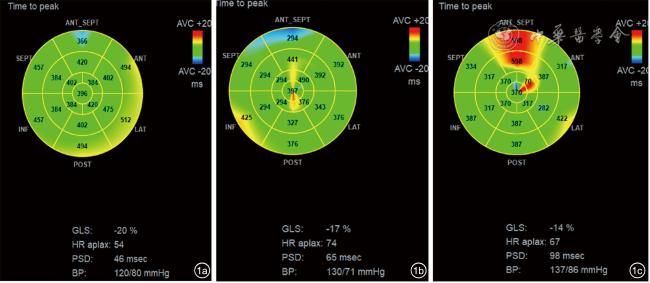
图1 左心室17节段应变达峰时间牛眼图。图a为健康者;图b为希浦系统起搏患者;图c为右心双腔室间隔起搏患者;图a~c左心室整体长轴应变呈依次递减趋势,应变达峰时间离散度(PSD)呈依次递增趋势 |
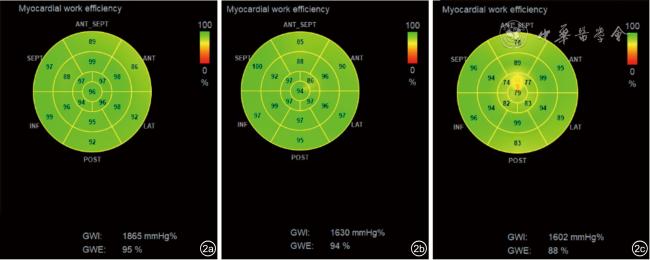
图2 左心室17节段心肌做功参数图像。图a为健康者;图b为希浦系统起搏者;图c为右心双腔室间隔起搏者(左心室做功效率希浦系统起搏者与健康者接近,右心双腔室间隔起搏者则呈现减低趋势) |
 表示。符合方差齐性的3组间计量资料比较采用单因素方差ANOVA法,两两比较采用LSD和SNK法,方差不齐的采用秩和检验。以P<0.05为差异有统计学意义。
表1 正常组与起搏组的一般资料比较( |
| 组别 | 例数 | 年龄 | BSA(kg/m2) | SPI(%) | LVEF(%) | EDV(ml) | ESV(ml) | HR(次/分) | SBP(mmHg) | DBP(mmHg) |
|---|---|---|---|---|---|---|---|---|---|---|
| RVSP组 | 20 | 69±12a | 1.63±0.16 | 0.41±0.10 | 58.20±5.87 | 81.90±12.89 | 34.90±11.41 | 74±11 | 137±13 | 75±13a |
| HPSP组 | 23 | 72±4a | 1.73±0.09 | 0.42±0.09 | 57.95±4.35 | 89.26±12.80 | 36.26±11.24 | 68±8 | 133±19 | 76±9a |
| 正常对照组 | 40 | 64±11 | 1.62±0.15 | 0.37±0.06 | 61.76±7.16 | 88.76±19.21 | 31.88±12.05 | 67±6 | 118±10 | 64±6 |
| F值 | 2.742 | 5.845 | 2.648 | 39.183 | 0.596 | 1.352 | 4.544 | 3.632 | 6.899 | |
| P值 | 0.025 | 0.167 | 0.064 | 0.988 | 0.624 | 0.232 | 0.452 | 0.242 | <0.001 |
注:BSA为体表面积;SPI为左心室球形指数;LVEF为左心室射血分数;EDV为左心室舒张末期容积;ESV为左心室收缩末期容积;HR为心率;SBP为收缩压;DBP为舒张压;RVSP为右心双腔室间隔起搏组;HPSP为希浦系统起搏组;1 mmHg=0.133 kPa;与正常组比,aP<0.05 |
表2 正常组与起搏组17节段二维斑点追踪应变达峰时间比较( |
| 节段 | HPSP组(n=23) | RVSP组(n=20) | 正常对照组(n=40) | F值 | P值 |
|---|---|---|---|---|---|
| 基底间隔 | 335.35±104.24 | 344.73±68.88 | 330.20±31.61 | 0.25 | 0.77 |
| 基底前间隔 | 438.86±86.93ab | 372.50±83.44a | 330.80±21.00 | 14.85 | <0.01 |
| 基底前壁 | 423.26±58.98ab | 390.10±58.47a | 334.40±16.48 | 21.29 | <0.01 |
| 基底侧壁 | 372.90±68.48a | 383.56±69.01a | 329.80±59.20 | 4.08 | 0.02 |
| 基底后壁 | 377.13±56.36 | 376.60±58.70 | 348.60±24.93 | 2.73 | 0.07 |
| 基底下壁 | 389.35±52.52ab | 324.91±43.97 | 339.04±76.18 | 4.62 | 0.01 |
| 中段间隔 | 334.95±49.62b | 368.78±88.48a | 321.40±19.17 | 7.25 | <0.01 |
| 中段前间隔 | 431.43±88.67ab | 379.86±97.34a | 322.20±20.32 | 12.82 | <0.01 |
| 中段前壁 | 415.21±76.45ab | 386.15±73.55a | 325.80±15.51 | 13.24 | <0.01 |
| 中段侧壁 | 369.21±36.92ab | 330.75±66.22 | 343.40±30.14 | 4.06 | 0.02 |
| 中段后壁 | 358.08±50.01 | 362.35±62.36 | 346.60±20.70 | 0.72 | 0.49 |
| 中段下壁 | 340.85±95.59 | 354.82±62.89 | 336.40±15.52 | 0.52 | 0.59 |
| 心尖段间隔 | 314.00±71.45b | 391.95±80.63a | 327.20±24.23 | 9.95 | <0.01 |
| 心尖前壁 | 419.91±79.59ab | 370.00±84.10a | 328.60±20.52 | 11.42 | <0.01 |
| 心尖侧壁 | 346.30±87.75a | 361.30±36.79a | 308.20±38.51 | 5.30 | <0.01 |
| 心尖下壁 | 385.95±69.13ab | 418.73±90.72a | 323.00±17.04 | 13.27 | <0.01 |
| 心尖帽 | 358.60±62.61ab | 399.82±65.01a | 335.00±23.40 | 9.83 | <0.01 |
注:RVSP为右心双腔室间隔起搏;HPSP为希浦系统起搏;与正常对照组比较,aP<0.05;与RVSP组比较,bP<0.05 |
表3 正常组与起搏组左心室基底和中段水平12节段组织多普勒TSI应变达峰时间比较( |
| 节段 | HPSP组(n=23) | RVSP组(n=20) | 对照组(n=40) | F值 | P值 |
|---|---|---|---|---|---|
| 基底间隔 | 145.08±35.29a | 145.40±39.86a | 83.08±12.16 | 34.38 | <0.01 |
| 基底前间隔 | 121.21±38.76a | 131.25±62.85a | 97.32±17.46 | 3.93 | 0.02 |
| 基底前壁 | 97.50±40.94ab | 136.86±61.07a | 74.56±16.98 | 12.69 | <0.01 |
| 基底侧壁 | 160.69±69.45a | 148.30±69.00a | 87.72±13.51 | 11.81 | <0.01 |
| 基底后壁 | 166.04±51.77a | 171.45±67.37a | 90.12±13.85 | 21.16 | <0.01 |
| 基底下壁 | 148.26±56.88a | 152.10±52.72a | 92.52±7.10 | 13.62 | <0.01 |
| 中段前间隔 | 105.55±16.46ab | 134.13±50.06a | 95.56±6.67 | 11.23 | <0.01 |
| 中段间隔 | 136.00±47.40ab | 153.70±48.33a | 82.64±41.04 | 19.57 | <0.01 |
| 中段前壁 | 125.86±49.87a | 110.35±47.65a | 84.24±6.96 | 6.99 | 0.02 |
| 中段侧壁 | 157.52±49.99a | 146.20±64.78a | 107.16±11.15 | 7.91 | <0.01 |
| 中段后壁 | 140.91±56.72ab | 156.25±70.48a | 91.44±11.99 | 10.24 | <0.01 |
| 中段下壁 | 156.95±53.38a | 148.70±44.19a | 66.72±15.32 | 36.56 | <0.01 |
注:TSI为组织多普勒同步化显像;RVSP为右心双腔室间隔起搏;HPSP为希浦系统起搏;与对照组比较,aP<0.05;与RVSP组比较,bP<0.05 |
表4 正常组与起搏组心肌做功参数及四维应变参数比较( |
| 组别 | 例数 | 4D-GLS(%) | GWI(mmHg%) | GWE(%) | GWW(mmHg%) | PSD(msec) |
|---|---|---|---|---|---|---|
| HPSP组 | 23 | -15.21±3.63b | 1959.30±601.37ab | 92.56±4.94b | 62.88±34.90ab | 67.69±20.88ab |
| RVSP组 | 20 | -10.95±2.30a | 1552.55±329.29a | 83.90±4.03a | 200.73±133.53a | 78.05±20.91a |
| 正常对照组 | 40 | -16.60±4.26 | 1982.96±239.50 | 96.40±1.73 | 303.14±93.87 | 34.80±6.99 |
| F值 | 13.787 | 7.900 | 32.800 | 32.726 | 31.978 | |
| P值 | 0.001 | 0.002 | <0.001 | <0.001 | <0.001 |
注:RVSP为右心双腔室间隔起搏;HPSP为希浦系统起搏;4D-GLS为四维左心室长轴整体应变;GWI为整体心肌做功指数;GWE为整体心肌做功效率;GWW为整体无效做功;PSD为应变达峰时间离散度;与正常对照组比较,aP<0.05;与RVSP组比较,bP<0.05 |
| 1 |
李秀娟, 付淑萍, 阮海东, 等. 超声心动图对左束支区域起搏电极定位及左心室收缩功能的评价 [J/OL]. 中华医学超声杂志(电子版), 2022, 19(2): 5.
|
| 2 |
孟庆国, 徐芸, 吴志霞, 等. 三维斑点追踪成像技术评估右心双腔间隔起搏对左心室功能的影响 [J]. 中国医学影像技术, 2018, 34(7): 1019-1023.
|
| 3 |
|
| 4 |
|
| 5 |
|
| 6 |
吴圣杰, 苏蓝, 黄伟剑. 希氏-浦肯野系统起搏的现状与展望 [J]. 中华心律失常学杂志, 2018, 22(2): 123-129.
|
| 7 |
李慧, 顾敏, 胡奕然, 等. 四维斑点追踪联合超声心动图分层应变技术评价不同部位起搏对左心室功能及同步性的影响[J/OL]. 中华医学超声杂志(电子版), 2021, 18(2): 135-142.
|
| 8 |
|
| 9 |
中华医学会心电生理和起搏分会, 中国医师协会心律学专业委员会, 希氏-浦肯野系统起搏中国专家共识 [J]. 中华心律失常学杂志, 2021, 25(1): 10-36.
|
| 10 |
|
| 11 |
|
| 12 |
严霜霜, 邓晓奇, 熊峰, 等. 二维斑点追踪技术评价左束支区域起搏早期左心室收缩功能及同步性 [J/OL]. 中华医学超声杂志(电子版), 2021,18 (4): 368-374.
|
| 13 |
|
| 14 |
|
| 15 |
|
| 16 |
|
| 17 |
|
| 18 |
|
| 19 |
|
| 20 |
|
| 21 |
|
| 22 |
|
| 23 |
|
| 24 |
|
| 25 |
|
| 26 |
|
| 27 |
|
| 28 |
|
| 29 |
王嫒嫒, 张连仲, 刘琳, 等. 峰值应变离散度评价原发性高血压患者左心室收缩同步性 [J]. 中国超声医学杂志, 2019, 35(7): 608-611.
|
| 30 |
|
| 31 |
|
/
| 〈 |
|
〉 |
 )
) ,ms)
,ms) ,ms)
,ms) )
)