
2024 , Vol. 21 >Issue 01: 42 - 48
DOI: https://doi.org/10.3877/cma.j.issn.1672-6448.2024.01.006
孕11~13+6周子宫动脉与左心室参数对子痫前期的预测模型构建与验证
Copy editor: 吴春凤
收稿日期: 2023-01-13
网络出版日期: 2024-03-27
版权
Construction and validation of a prediction model for pre-eclampsia based on uterine artery and left ventricular parameters at 11-13+6 weeks of pregnancy
Received date: 2023-01-13
Online published: 2024-03-27
Copyright
探讨孕11-13+6周孕妇子宫动脉血流及左心室参数与子痫前期的相关性及其预测价值。
选取2020年1月至2022年9月于哈尔滨医科大学附属第四医院首次产检的孕11~13+6周孕妇,收集孕妇临床资料,包括年龄、收缩压、舒张压、平均动脉压(MAP)等参数,应用超声检测子宫动脉搏动指数(PI)、阻力指数(RI)、收缩期/舒张期血流速度(S/D)、左心室二尖瓣环舒张早期平均峰值速度(e')、二尖瓣舒张早期峰值流速/二尖瓣环舒张早期平均峰值速度(E/e')等参数,随访获得子痫前期组108例,随机选取同期符合标准正常孕妇110例作为对照组,采用t检验或U检验比较2组间各参数的差异。通过Logistic回归法筛选出子痫前期的独立影响因素并构建预测子痫前期的诺曼模型,通过受试者操作特征(ROC)曲线对预测模型的准确性进行评估,绘制校准曲线分析预测模型的校准度。
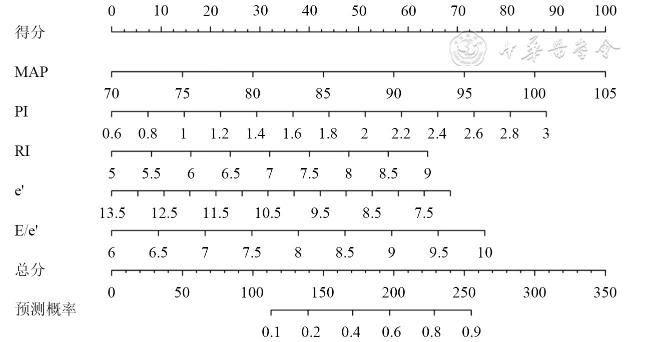
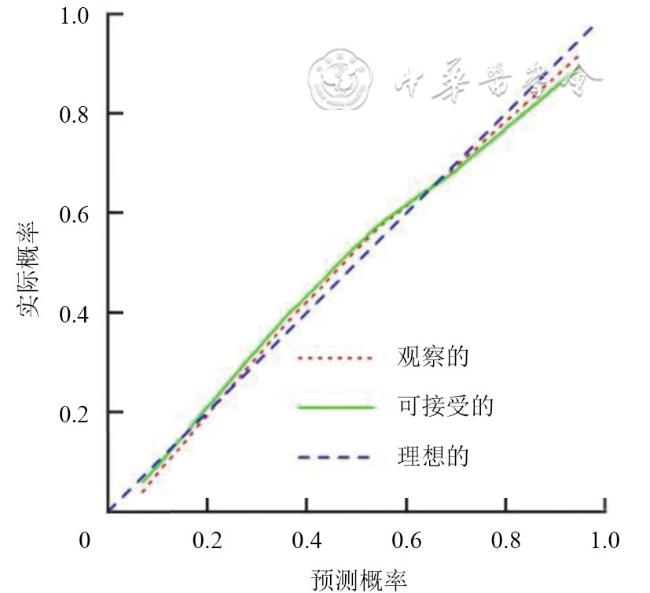
与对照组比较,子痫前期组孕妇年龄[(30.07±5.03)岁vs(29.35±6.49)岁]、收缩压[(111.75±5.20)mmHg vs(109.62±8.19)mmHg]、舒张压[(70.06±6.37)mmHg vs(68.62±6.35)mmHg]、MAP[(82.30±7.54)mmHg vs(81.06±7.27)mmHg]、子宫动脉PI[(1.85±0.64)vs(1.64±0.57)]、RI[(0.71±0.12)vs(0.69±0.11)]、S/D[(4.33±1.64)vs(4.25±1.70)]和左心室E/e'[(8.32±0.91)vs(7.54±0.84)]比较均高,左心室e'小于对照组[(9.81±1.74)cm/s vs(10.63±1.82)cm/s],差异均具有统计学意义(t=0.923、2.309、1.601、1.167、2.441、1.240、0.937、6.301、3.256;P=0.034、0.008、0.010、0.014、0.005、0.013、0.025、0.001、0.002)。Logistic回归法筛选得出孕妇MAP[比值比(OR)=1.08,P=0.002]、子宫动脉PI(OR=2.54,P=0.004)、RI(OR=1.56,P=0.012)、左心室e'(OR=0.71,P=0.004)、E/e'(OR=1.68,P=0.013)是子痫前期的独立影响因素。诺曼模型预测子痫前期的ROC曲线下面积为0.81(95%CI:0.75~0.87),敏感度为73.14%,特异度为77.82%,预测模型校准度良好,对子痫前期的预测具有较好的准确性。
孕11~13+6周孕妇的MAP、子宫动脉PI、RI以及左心室e'、E/e'对子痫前期的预测具有一定的临床参考价值;基于早孕期孕妇MAP、子宫动脉PI、RI以及左心室e'、E/e'构建的诺曼模型预测子痫前期具有较好的准确性,对子痫前期患者的早期管理具有重要意义,可在一定程度上提高临床诊断效能。
梁越 , 董晓秋 , 李奇默 , 李岩 , 姚金来 , 朴雪梅 . 孕11~13+6周子宫动脉与左心室参数对子痫前期的预测模型构建与验证[J]. 中华医学超声杂志(电子版), 2024 , 21(01) : 42 -48 . DOI: 10.3877/cma.j.issn.1672-6448.2024.01.006
To assess the predictive value of uterine artery and left ventricular parameters for pre-eclampsia in women at 11-13+6 weeks of pregancy.
Pregnant women at 11-13+6 weeks of gestation who had their first prenatal examination at the Fourth Affiliated Hospital of Harbin Medical University from January 2020 to September 2022 were selected, and their clinical data were collected, including age, systolic blood pressure, diastolic blood pressure, mean arterial pressure (MAP), and other parameters.Ultrasound was applied to detect the uterine artery pulsatility index (PI), resistance index (RI), systolic/diastolic velocity ratio (S/D), left ventricular mean early diastolic mitral annular velocity (e'), mitral early diastolic peak velocity/mean early diastolic mitral annular velocity (E/e'), and other parameters. Pregnancy outcomes were recorded, based on which 108 cases of pre-eclampsia were identified, and 110 normal pregnant women were randomly selected as a control group. The t test or U test was used to compare the differences in the above parameters between the two groups. The independent influencing factors of pre-eclampsia were screened out by Logistic regression analysis, and a prediction model was constructed based on these factors. The accuracy of the prediction model was evaluated by receiver operating characteristic curve analysis, and the calibration curve was drawn to analyze the calibration degree of the prediction model.
Age [(30.07±5.03) vs (29.35±6.49)], systolic blood pressure [(111.75±5.20) mmHg vs (109.62±8.19) mmHg], diastolic blood pressure [(70.06±6.37) mmHg vs (68.62±6.35) mmHg], MAP [(82.30±7.54) mmHg vs (81.06±7.27) mmHg], uterine artery PI [(1.85±0.64) vs (1.64±0.57)], RI [(0.71±0.12) vs (0.69±0.11)], S/D [(4.33±1.64) vs (4.25±1.70)], and left ventricular E/e' [(8.32±0.91) vs (7.54±0.84)] of pregnant women in the pre-eclampsia group were significantly greater than those of the control group (t=0.923, 2.309, 1.601, 1.167, 2.441, 1.240, 0.937, and 6.301; P=0.034, 0.008, 0.010, 0.014, 0.005, 0.013, 0.025, and 0.001, respectively), while the e' [(9.81±1.74) vs (10.63±1.82)] of the left ventricle was smaller than that of the control group (t=3.256, P=0.002). Logistic regression analysis identified that MAP, uterine artery PI and RI, and left ventricular e' and E/e' were independent influencing factors of pre-eclampsia (odds ratio=1.08, 2.54, 1.56, 0.71, and 1.68; P=0.002, 0.004, 0.012, 0.004, and 0.013, respectively). The area under the curve of the nomogram model based on the above independent influencing factors for predicting pre-eclampsia was 0.81 (95% confidence interval: 0.75-0.87), with a sensitivity of 73.14% and specificity of 77.82%. The prediction model was well calibrated and had a high predictive accuracy for pre-eclampsia.
MAP, uterine artery PI and RI, and left ventricular e' and E/e' of pregnant women at 11-13+6 weeks of pregnancy have appreciated value for the prediction of pre-eclampsia. The nomogram model constructed based on MAP, uterine artery PI and RI, and left ventricular e' and E/e' of pregnant women in early pregnancy has good accuracy in predicting pre-eclampsia, is of great significance for the early management of patients with pre-eclampsia, and can improve the efficiency of clinical diagnosis.
Key words: Pre-eclampsia; Uterine artery; Echocardiogram; Left ventricular; Nomogram model
 表示,用t检验进行组间比较;左心室形态和功能参数IVSd、LVPWd、LVEDD为非正态分布的计量资料,采用M(QR)表示,采用Mann-Whitney U检验进行组间比较。通过Logistic逐步回归筛选出独立影响因素,应用R 4.1.2软件构建预测子痫前期的诺曼模型,因RI原始单位数量级与其他单位存在差距,将其转换为10倍RI后得出预测模型。采用受试者操作特征(receiver operating characteristic,ROC)曲线的曲线下面积评估诺曼模型的预测效能;绘制校准曲线,行霍斯默-莱梅肖检验评估模型的拟合度。以P<0.05为差异有统计学意义。
表1 2组孕妇一般临床特征参数比较( |
| 组别 | 例数 | 年龄(岁) | 胎次(次) | 心率(次/min) | BMI(kg/m2) | 收缩压(mmHg) | 舒张压(mmHg) | MAP(mmHg) |
|---|---|---|---|---|---|---|---|---|
| 子痫前期组 | 108 | 30.07±5.03 | 1.69±0.45 | 80.73±6.38 | 26.72±2.43 | 111.75±5.20 | 70.06±6.37 | 82.30±7.54 |
| 对照组 | 110 | 29.35±6.49 | 1.68±0.61 | 79.81±8.33 | 26.70±1.87 | 109.62±8.19 | 68.62±6.35 | 81.06±7.27 |
| t值 | 0.923 | 0.137 | 0.875 | 0.063 | 2.309 | 1.601 | 1.167 | |
| P值 | 0.034 | 0.536 | 0.055 | 0.971 | 0.008 | 0.010 | 0.014 |
注:BMI为体质量指数;MAP为平均动脉压;1 mmHg=0.133 kPa |
表2 2组孕妇子宫动脉血流参数比较( |
| 组别 | 例数 | PI | RI | S/D |
|---|---|---|---|---|
| 子痫前期组 | 108 | 1.85±0.64 | 0.71±0.12 | 4.33±1.64 |
| 对照组 | 110 | 1.64±0.57 | 0.69±0.11 | 4.25±1.70 |
| t值 | 2.441 | 1.240 | 0.937 | |
| P值 | 0.005 | 0.013 | 0.025 |
注:PI为搏动指数;RI为阻力指数;S/D为收缩期/舒张期血流速度 |
表3 2组孕妇左心室形态与功能参数比较 |
| 参数 | 子痫前期组(n=108) | 对照组(n=110) | 统计值 | P值 |
|---|---|---|---|---|
| IVSd[mm,M(QR)] | 8.83(8.42,9.34) | 8.82(8.36,9.21) | Z=0.113 | 0.627 |
| LVPWd[mm,M(QR)] | 9.17(8.87,9.49) | 9.14(8.76,9.45) | Z=0.404 | 0.170 |
| LVEDD[mm,M(QR)] | 45.24(41.33,47.11) | 45.12(41.27,46.95) | Z=0.541 | 0.138 |
LVEF(%, ) ) | 65.23±3.86 | 65.49±3.79 | t=0.480 | 0.162 |
FS(%, ) ) | 33.12±3.59 | 33.27±3.63 | t=0.293 | 0.241 |
E(m/s, ) ) | 0.83±0.14 | 0.83±0.15 | t=0.291 | 0.244 |
A(m/s, ) ) | 0.58±0.08 | 0.58±0.07 | t=0.737 | 0.102 |
e'(cm/s, ) ) | 9.81±1.74 | 10.63±1.82 | t=3.256 | 0.002 |
E/A( ) ) | 1.43±0.35 | 1.44±0.34 | t=0.214 | 0.375 |
E/e'( ) ) | 8.32±0.91 | 7.54±0.84 | t=6.301 | 0.001 |
注:IVSd为左室舒张末期室间隔厚度;LVPWd为左室舒张末期后壁厚度;LVEDD为左室舒张末期内径;LVEF为左室射血分数;FS为缩短分数;E为二尖瓣舒张早期峰值流速;A为二尖瓣舒张晚期峰值流速;e'为二尖瓣环舒张早期平均峰值速度;E/A为二尖瓣舒张早期峰值流速/舒张晚期峰值流速;E/e'为二尖瓣舒张早期峰值流速/二尖瓣环舒张早期平均峰值速度 |
表4 孕妇临床特征参数、子宫动脉参数及左心室参数对子痫前期影响的多因素分析 |
| 因素 | 回归系数 | 标准误 | 比值比 | 95%可信区间 | P值 |
|---|---|---|---|---|---|
| MAP | 0.08 | 0.03 | 1.08 | 1.03~1.14 | 0.002 |
| PI | 0.93 | 0.33 | 2.54 | 1.34~4.86 | 0.004 |
| RI | 0.44 | 0.18 | 1.56 | 1.10~2.21 | 0.012 |
| e' | -0.34 | 0.11 | 0.71 | 0.57~0.89 | 0.004 |
| E/e' | 0.52 | 0.21 | 1.68 | 1.12~2.51 | 0.013 |
注:MAP为平均动脉压;PI为搏动指数;RI为阻力指数;e'为二尖瓣环舒张早期平均峰值速度;E/e'为二尖瓣舒张早期峰值流速/二尖瓣环舒张早期平均峰值速度 |
| 1 |
中华医学会妇产科学分会妊娠期高血压疾病学组. 妊娠期高血压疾病诊治指南(2020) [J]. 中华妇产科杂志, 2020, 55(4): 227-238.
|
| 2 |
王伽略, 杨孜. 子痫前期发生和发展过程中的预防 [J]. 中华产科急救电子杂志, 2021, 10(3): 133-137.
|
| 3 |
ACOG Practice Bulletin No.202: Gestational Hypertension and Pre-eclampsia [J]. Obstet Gynecol, 2020, 135(6): e237-e260.
|
| 4 |
|
| 5 |
储倩倩, 张羽. 再谈子痫前期的预测 [J/OL].中华产科急救电子杂志, 2021, 10(4): 201-205.
|
| 6 |
|
| 7 |
|
| 8 |
|
| 9 |
|
| 10 |
|
| 11 |
|
| 12 |
李晓菲, 吴青青, 马玉庆, 等. 妊娠早期子宫动脉血流频谱与不良妊娠结局的相关性研究 [J/CD]. 中华医学超声杂志(电子版), 2011, 8(4): 786-793.
|
| 13 |
|
| 14 |
|
| 15 |
寿列军, 解左平, 孙雪东, 等. 运用超声心动图评价妊娠期高血压疾病患者左室形态和功能变化及其与N端脑利钠肽前体的相关性研究 [J/CD]. 中华危重症医学杂志(电子版), 2017, 10(2): 103-108.
|
| 16 |
|
/
| 〈 |
|
〉 |


 )
) )
)
