
2024 , Vol. 21 >Issue 06: 571 - 579
DOI: https://doi.org/10.3877/cma.j.issn.1672-6448.2024.06.004
超声影像组学联合临床病理特征预测乳腺癌新辅助化疗完全病理缓解的价值
Copy editor: 汪荣
收稿日期: 2024-03-07
网络出版日期: 2024-08-05
基金资助
湖北省自然科学基金联合基金项目(2022CFD066)
版权
Value of ultrasound radiomics combined with clinicopathological features in predicting complete pathological response to neoadjuvant chemotherapy for breast cancer
Received date: 2024-03-07
Online published: 2024-08-05
Copyright
基于乳腺癌患者新辅助化疗(NAC)前临床病理特征和超声影像组学特征构建预测病理完全缓解(pCR)的临床模型、影像组学模型及两者联合模型,探讨3种模型预测NAC疗效的临床价值。
回顾性收集2019年1月至2024年1月在黄石市中心医院行乳腺癌NAC并有疗效病理评估结果的女性患者202例,将两个不同院区的病例分为训练集(107例)和验证集(95例)。训练集中,采用单因素和多因素Logistic回归筛选有统计学意义的临床病理特征并构建临床模型;采用最小绝对收缩和选择算子(LASSO)回归筛选影像组学特征建立影像组学模型,并根据特征参数及其回归系数计算每例患者的影像组学评分(Radscore);采用多因素Logistic回归构建临床病理特征和Radscore的联合预测模型。采用ROC曲线及决策曲线评价并验证3种模型的预测效能及临床应用价值。
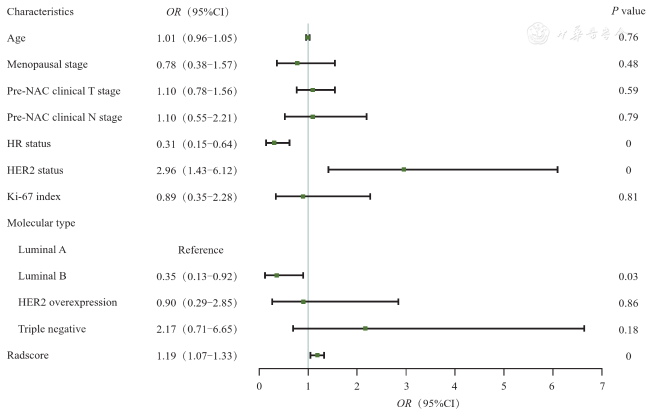
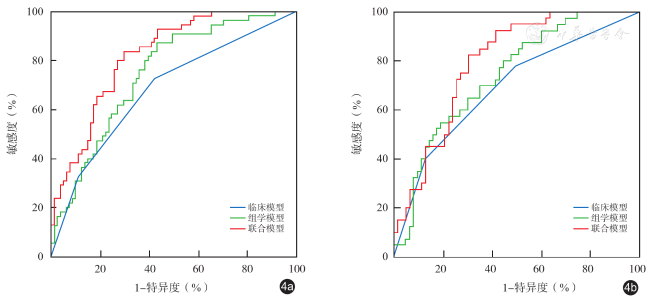
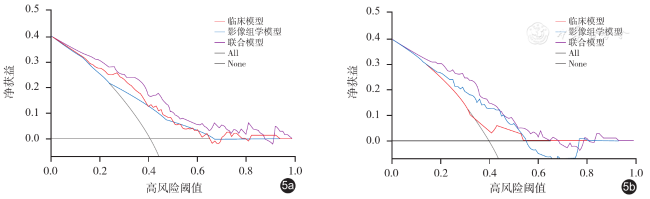
训练集中,激素受体(HR)状态和人表皮生长因子受体2(HER2)状态纳入多因素Logistic回归建立临床模型;LASSO回归筛选出对比度、相关度、熵、灰度不均匀性、游程百分比这5个最佳影像组学特征建立影像组学模型;单因素Logistic回归显示Radscore有统计学意义。纳入HR状态(OR值:0.31,95%CI:0.15~0.64,P < 0.01)、HER2状态(OR值:2.96,95%CI:1.43~6.12,P < 0.01)和Radscore(OR值:1.19,95%CI:1.07~1.33,P < 0.01)这3个指标构建联合模型。训练集中临床模型、影像组学模型、联合模型预测pCR的AUC分别为0.68、0.75、0.82,验证集中临床模型、影像组学模型、联合模型预测pCR的AUC分别为0.68、0.72、0.79。联合模型的决策曲线净获益最高,影像组学模型次之,临床模型最低。
临床模型、影像组学模型和联合模型对乳腺癌NAC疗效(是否pCR)预测均有一定的临床价值,其中联合模型的效能最优,具有最佳的预测性能和临床适用性。
洪玮 , 叶细容 , 刘枝红 , 杨银凤 , 吕志红 . 超声影像组学联合临床病理特征预测乳腺癌新辅助化疗完全病理缓解的价值[J]. 中华医学超声杂志(电子版), 2024 , 21(06) : 571 -579 . DOI: 10.3877/cma.j.issn.1672-6448.2024.06.004
To construct a clinical model, an imaging model, and a combined model for predicting pathological complete response (pCR) based on the clinicopathological characteristics and ultrasound imaging characteristics of breast cancer patients before neoadjuvant chemotherapy (NAC), and to compare the clinical value of the three models in predicting the efficacy of NAC.
A total of 202 female patients who underwent NAC for breast cancer at Huangshi Central Hospital from January 2019 to January 2024 and had the results of pathologic evaluation were retrospectively collected. The cases from two different hospital districts were classified into a training set (107 cases) and a validation set (95 cases). In the training set, univariate and multivariate logistic regression analyses were performed to identify clinically significant features and construct a clinical model. The minimum absolute contraction and selection operator regression were used to screen the radiomics features and establish a radiomics model. The Radscore of each patient was calculated according to the characteristic parameters and their regression coefficients. Multivariate logistic regression was then used to construct a combined prediction model based on statistically significant clinicopathological features and Radscore. Receiver operating characteristic (ROC) curve and decision curve were used to evaluate and verify the predictive efficacy and clinical value of the three models.
In the training set, hormone receptor (HR) status and human epidermal growth factor receptor 2 (HER2) status were included in the multivariate logistic regression to establish a clinical model. Lasso regression was used to select five best radiomics features, namely, contrast, correlation, entropy, gray unevenness, and percentage of run, to establish a radiomics model. Univariate logistic regression showed that Radscore was significantly different between patients with and without pCR. HR status (odds ratio [OR]: 0.31, 95% confidence interval [CI]: 0.15-0.64, P < 0.01), HER2 status (OR: 2.96, 95%CI: 1.43-6.12, P < 0.01), and Radscore (OR: 1.19, 95%CI: 1.07-1.33, P < 0.01) were included to build a combined model. In the training set, the area under the ROC curve (AUC) of the clinical model, radiomics model, and combined model in predicting pCR was 0.68, 0.75, and 0.82, respectively. In the validation set, the AUC of the clinical model, radiomics model, and combined model in predicting pCR was 0.68, 0.72, and 0.79, respectively. The combined model had the highest net benefit value in the decision curve analysis, followed by the radiomics model and the clinical model.
The clinical model, radiomics model, and combined model are all clinically valuable for predicting NAC efficacy in breast cancer, with the combined model having the best efficacy, predictive performance, and clinical applicability.
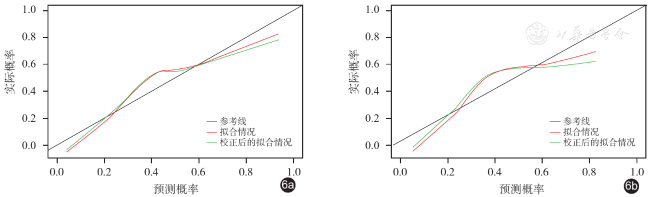
 ±s表示,两组间比较采用独立样本t检验。计数资料以例数(%)表示,两组间比较采用χ 2检验或Fisher确切概率检验。采用单因素Logistic回归分析筛选出P < 0.01的临床特征进行多因素Logistic回归构建临床模型。采用LASSO回归筛选出最佳影像组学特征构建影像组学模型。采用多因素Logistic回归构建联合临床病理特征和Radscore的联合模型。采用Hosmer-Lemeshow检验评价模型的拟合优度,P > 0.05表示模型拟合效果好。以ROC曲线、校准曲线和决策曲线评价模型的区分度、校准度和临床适用性,并绘制模型列线图。以P < 0.05为差异有统计学意义。
表1 训练集与验证集患者的临床病理资料[例(%)] |
| 临床病理资料 | 训练集 | 验证集 | ||
|---|---|---|---|---|
| pCR(n=44) | non-pCR(n=63) | pCR(n=38) | non-pCR(n=57) | |
年龄(岁, ±s) ±s) | 49.15±8.19 | 48.74±7.26 | 47.63±9.25 | 48.46±8.33 |
| 绝经状态 | ||||
| 绝经前 | 26(59.1) | 40(63.5) | 23(60.5) | 38(66.7) |
| 绝经后 | 18(40.9) | 23(36.5) | 15(39.5) | 19(33.3) |
| 临床T分期 | ||||
| 1~2期 | 24(54.5) | 37(58.7) | 21(55.3) | 34(59.6) |
| 3~4期 | 20(45.5) | 26(41.3) | 17(44.7) | 23(40.4) |
| 临床N分期 | ||||
| 0~1期 | 26(59.1) | 38(60.3) | 22(57.9) | 35(61.4) |
| 2~3期 | 18(40.9) | 25(39.7) | 16(42.1) | 22(38.6) |
| HR状态 | ||||
| 阴性 | 24(54.5) | 17(27.0) | 20(52.6) | 16(28.1) |
| 阳性 | 20(45.5) | 46(73.0) | 18(47.4) | 41(71.9) |
| HER2状态 | ||||
| 阴性 | 22(50.0) | 47(74.6) | 20(52.6) | 42(73.7) |
| 阳性 | 22(50.0) | 16(25.4) | 18(47.4) | 15(26.3) |
| Ki-67水平 | ||||
| 低表达 | 7(15.9) | 9(14.3) | 7(18.4) | 7(12.3) |
| 高表达 | 37(84,1) | 54(85.7) | 31(81.6) | 50(87.7) |
| 分子分型 | ||||
| Luminal A型 | 12(27.3) | 37(58.7) | 10(26.3) | 32(56.1) |
| Luminal B型 | 8(18.2) | 9(14.3) | 7(18.4) | 10(17.5) |
| HER2过表达型 | 14(31.8) | 8(12.7) | 12(31.6) | 7(12.3) |
| 三阴型 | 10(22.7) | 9(14.3) | 9(23.7) | 8(14.0) |
注:pCR为病理完全缓解;non-pCR为非病理完全缓解;HR为激素受体;HER2为人类表皮生长因子受体2;Ki-67为增殖细胞核抗原 |
图3 森林图展示训练集各临床病理特征及影像组学评分的单因素Logistics回归分析结果注:Characteristics为特征;Age为年龄;Menopausal stage为绝经状态;Pre-NAC clinical T stage为临床T分期;Pre-NAC clinical N stage为临床N分期;HR status为激素受体状态;HER2 status为人类表皮生长因子受体2状态;Ki-67 index为增殖细胞核抗原水平;Molecular type为分子分型;HER2 overexpression为HER2过表达型;Triple negative为三阴型;Radscore为影像组学评分;OR为比值比;95%CI为95%置信区间;P value为P值 |
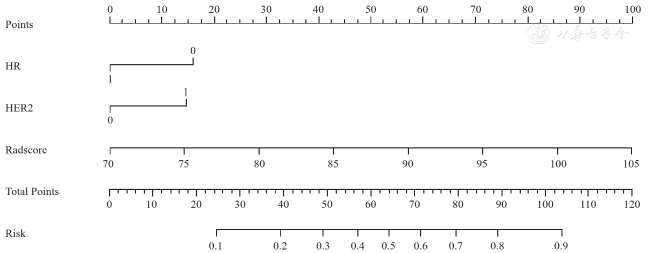
图7 联合模型预测乳腺癌患者新辅助化疗后病理完全缓解的列线图注:HR为激素受体状态(1代表阳性,0代表阴性);HER2为人类表皮生长因子受体2状态(1代表阳性,0代表阴性);Radscore为影像组学评分 |
表2 3种模型在训练集和验证集的预测性能 |
| 模型 | AUC(95%CI) | 特异度[%,(95%CI)] | 敏感度[%,(95%CI)] | 准确性(%) |
|---|---|---|---|---|
| 训练集(n=107) | ||||
| 临床模型 | 0.68(0.60~0.77) | 58.02(46.5~68.9) | 72.73(59.0~83.9) | 63.97 |
| 影像组学模型 | 0.75(0.67~0.83) | 56.79(45.3~67.8) | 87.27(75.5~94.7) | 69.12 |
| 联合模型 | 0.82(0.75~0.89) | 70.37(59.2~80.0) | 83.64(71.2~92.2) | 75.74 |
| 验证集(n=95) | ||||
| 临床模型 | 0.68(0.58~0.78) | 71.43(58.7~82.1) | 57.50(40.9~73.0) | 65.05 |
| 影像组学模型 | 0.72(0.62~0.82) | 80.95(69.1~89.8) | 55.00(38.5~70.7) | 69.90 |
| 联合模型 | 0.79(0.70~0.87) | 69.84(57.0~80.8) | 82.50(67.2~92.7) | 72.82 |
注:AUC为ROC曲线下面积;CI为置信区间 |
| 1 |
|
| 2 |
|
| 3 |
《中国乳腺癌新辅助治疗专家共识(2022年版)》专家组. 中国乳腺癌新辅助治疗专家共识(2022年版) [J]. 中国癌症杂志, 2022, 32 (1): 80-89.
|
| 4 |
|
| 5 |
|
| 6 |
|
| 7 |
|
| 8 |
|
| 9 |
|
| 10 |
|
| 11 |
|
| 12 |
|
| 13 |
|
| 14 |
|
| 15 |
陈瑾, 王海屹, 叶慧义. 纹理分析在肿瘤影像学中的研究进展 [J].中华放射学杂, 2017, 51(12): 979-982.
|
| 16 |
|
| 17 |
|
/
| 〈 |
|
〉 |