
2024 , Vol. 21 >Issue 12: 1095 - 1102
DOI: https://doi.org/10.3877/cma.j.issn.1672-6448.2024.12.001
超声黏弹性成像技术对≤3 cm 乳腺肿块良恶性的鉴别诊断价值
Copy editor: 汪荣
网络出版日期: 2025-01-23
基金资助
江西省重点研发计划(20203BBGL73196)
版权
Value of ultrasound viscoelastic imaging technology in differential diagnosis of benign and malignant breast masses≤3 cm
Online published: 2025-01-23
Copyright
目的
分析乳腺肿块的黏度特征并探讨超声黏弹性成像技术在乳腺肿块良恶性鉴别中的应用价值。
方法
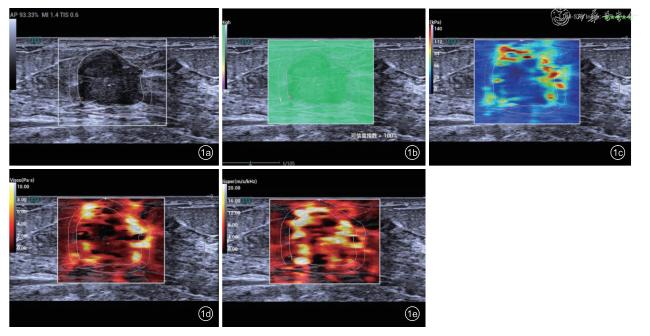
前瞻性收集2023 年9 月至2024 年6 月就诊于南昌大学第一附属医院的乳腺肿块(≤3 cm)患者151 例。穿刺活检或手术前均行常规超声、超声黏弹性成像及剪切波弹性成像检查,测量肿块区及其周围2 mm 腺体组织的弹性参数及黏弹性参数值。以病理学检查结果为金标准,选择受试者工作特征曲线下面积(AUC)最大的弹性及黏弹性相关参数为最优参数,根据其最优截断值调整超声乳腺影像报告和数据系统(BI-RADS)分类,比较调整前后的诊断效能及准确性。
结果
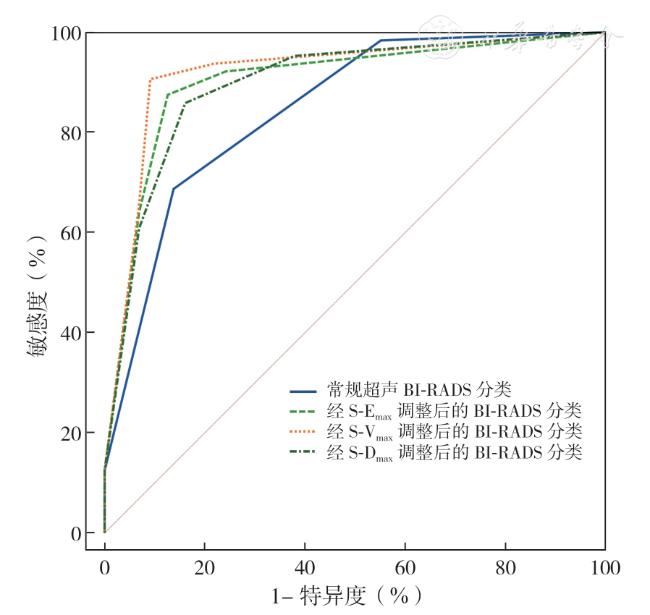
本研究纳入151 例病灶,87 例良性,64 例恶性。鉴别乳腺肿块良恶性的最佳弹性相关参数为肿块周围2 mm 腺体组织的弹性最大值(S-Emax),最佳黏性系数相关参数为肿块周围2 mm 腺体组织的黏性系数最大值(S-Vmax),最佳频散系数相关参数为肿块周围2 mm 腺体组织的频散系数最大值(S-Dmax),最佳截断值分别为89.76 kPa、6.31 Pa·s、15.37 m/s/kHz。经S-Emax、S-Vmax、S-Dmax 最佳截断值调整BI-RADS 分类后,诊断准确性分别为88.08%、90.73%、84.77%,AUC 分别为0.902、0.920、0.899,均较调整前的准确性(80.13%)及AUC(0.847)增加(均P<0.05)。其中,经S-Vmax 调整后的BIRADS 分类的AUC 最高,但较于其他两者差异无统计学意义(均P>0.05)。
结论
超声黏弹性成像技术能够反映乳腺肿块及其周围组织的黏度信息,在乳腺肿块的良恶性鉴别中具有与剪切波弹性成像技术相当的诊断效能,具有潜在的临床应用价值。
朱彩霞 , 刘志兴 , 谌芳群 , 王婧玲 , 姚谨 , 彭星琦 , 毛毅 , 陈莉 . 超声黏弹性成像技术对≤3 cm 乳腺肿块良恶性的鉴别诊断价值[J]. 中华医学超声杂志(电子版), 2024 , 21(12) : 1095 -1102 . DOI: 10.3877/cma.j.issn.1672-6448.2024.12.001
Objective
To analyze the viscosity characteristics of breast masses and investigate the clinical value of ultrasound viscoelasticity imaging in the differential diagnosis of benign and malignant breast masses.
Methods
A total of 151 patients with breast masses (≤3 cm ) were prospectively collected in the First Affiliated Hospital of Nanchang University from September 2023 to June 2024.Conventional ultrasound, ultrasound viscoelasticity imaging, and shear wave elastography were performed before puncture biopsy or surgery.The elastic parameters and viscoelastic parameter values of the mass area and the 2 mm glandular tissue around the mass were measured.Taking the pathological results as the gold standard, the elastic and viscoelastic parameters with the largest area under the receiver operating characteristic curve(AUC) were selected as the optimal parameters.The breast imaging reporting and data system (BI-RADS)classification was adjusted according to the optimal cutoff values, and the adjusted diagnostic efficacy and accuracy were compared.
Results
This study included 151 lesions, of which 87 were diagnosed as benign lesions and 64 as malignant lesions.The best elasticity-related parameter for distinguishing benign and malignant breast masses was the maximum elasticity value of 2 mm glandular tissue around the mass(S-Emax), the best viscosity coefficient-related parameter was the maximum viscosity coefficient value of 2 mm glandular tissue around the mass (S-Vmax), and the best dispersion coefficient-related parameter was the maximum dispersion coefficient value of 2 mm glandular tissue around the mass (S-Dmax).The best cutoffvalues of these parameters were 89.76 kPa, 6.31 Pa·s, and 15.37 m/s/kHz, respectively.After adjusting the BI-RADS classification by the optimal cutoff values of S-Emax, S-Vmax, and S-Dmax, the accuracy rates were 88.08%, 90.73%, and 84.77%, and the AUC were 0.902, 0.920, and 0.899, respectively, which were all higher than the accuracy (80.13%) and AUC (0.847) before adjustment (P<0.05).Among them, the AUC of BIRADS classification adjusted by S-Vmax was the highest, but there was no significant difference compared with those of the other two (P>0.05).
Conclusions
Ultrasound viscoelasticity imaging technology can reflect the viscosity information of breast masses and their surrounding tissues.It has diagnostic efficacy comparable to that of shear wave elastography in differentiating benign from malignant breast masses and has potential clinical application value.
Key words: Breast mass; Ultrasonography; Viscoelasticity; Elasticity; Differential diagnosis
 ±s 表示,组间比较采用独立样本Student t 检验;计数资料以例(%)表示,组间比较采用χ2 检验。以病理学检查结果为金标准,绘制ROC 曲线,确定各弹性及黏弹性参数的最佳诊断截断值,根据其调整BI-RADS 分类,采用DeLong 检验比较调整前后的曲线下面积(area under curve,AUC),评价诊断效能。操作者间及操作者内测量的一致性分析采用组内相关系数(interclass correlation coefficient,ICC)。以P<0.05 为差异有统计学意义。
表1 151 例乳腺病灶的病理类型 |
| 病理类型 | 病灶数[例(%)] |
|---|---|
| 恶性组(n=64) | |
| 浸润性癌 | 55(85.9) |
| 导管内原位癌 | 5(7.8) |
| 导管内乳头状癌 | 2(3.1) |
| 恶性叶状肿瘤 | 1(1.6) |
| 黏液癌 | 1(1.6) |
| 良性组(n=87) | |
| 纤维腺瘤 | 26(29.9) |
| 腺病 | 26(29.9) |
| 导管内乳头状瘤 | 3(3.4) |
| 肉芽肿性小叶炎 | 2(2.3) |
| 化脓性炎 | 1(1.1) |
| 其他良性病变 | 29(33.4) |
表2 乳腺良恶性肿块的常规超声特征及BI-RADS 分类[例(%)] |
| 超声特征 | 恶性(n=64) | 良性(n=87) | χ 2值 | P值 |
|---|---|---|---|---|
| 结节形状 | 30.865 | <0.001 | ||
| 圆形或椭圆形 | 3(4.7) | 40(45.8) | ||
| 不规则 | 61(95.3) | 47(54.2) | ||
| 内部回声 | 30.865 | <0.001 | ||
| 均匀 | 3(4.7) | 40(45.8) | ||
| 不均匀 | 61(95.3) | 47(54.2) | ||
| 边缘 | 65.342 | <0.001 | ||
| 规整 | 6(9.4) | 66(75.9) | ||
| 模糊、毛刺、成角、分叶 | 58(90.6) | 21(24.1) | ||
| 钙化 | 15.942 | <0.001 | ||
| 无 | 24(37.5) | 61(70.1) | ||
| 有 | 40(62.5) | 26(29.9) | ||
| 后方回声衰减 | 43.371 | <0.001 | ||
| 无 | 19(29.7) | 72(82.8) | ||
| 有 | 45(70.3) | 15(17.2) | ||
| 高回声晕 | 80.549 | <0.001 | ||
| 无 | 20(31.3) | 86(98.9) | ||
| 有 | 44(68.7) | 1(1.1) | ||
| 纵横比 | 10.428 | 0.001 | ||
| ≤1 | 35(54.7) | 69(79.3) | ||
| >1 | 29(45.3) | 18(20.7) | ||
| Adler血流分级 | 57.745 | <0.001 | ||
| 0~Ⅰ级 | 10(15.6) | 68(78.2) | ||
| Ⅱ~Ⅲ级 | 54(84.4) | 19(21.8) | ||
| BI-RADS分类 | 47.732 | <0.001 | ||
| 3~4a | 20(31.3) | 75(86.2) | ||
| 4b~5 | 44(68.7) | 12(13.8) |
表3 乳腺良恶性肿块弹性成像及黏弹性成像各参数的诊断效能 |
| 参数 | 恶性组(n=64) | 良性组(n=87) | t值 | P值 | 截断值 | 敏感度(%) | 特异度(%) | 约登指数 | AUC | 95%CI |
|---|---|---|---|---|---|---|---|---|---|---|
| E(kPa) | ||||||||||
| Emean | 27.42±12.43 | 22.70±13.4 | 2.202 | 0.029 | >19.03 | 79.69 | 48.28 | 0.28 | 0.640 | 0.558~0.716 |
| Emax | 141.50±56.69 | 66.09±48.37 | 8.798 | <0.001 | >93.53 | 82.81 | 86.21 | 0.69 | 0.876 | 0.812~0.924 |
| Emin | 3.10±3.12 | 6.20±4.96 | -4.698 | <0.001 | ≤3.65 | 75.00 | 59.77 | 0.35 | 0.732 | 0.654~0.801 |
| Esd | 17.49±6.86 | 10.17±7.42 | 6.182 | <0.001 | >10.34 | 85.94 | 66.67 | 0.53 | 0.815 | 0.743~0.873 |
| S-Emean | 35.79±12.91 | 22.87±13.04 | 6.042 | <0.001 | >25.63 | 81.25 | 74.71 | 0.56 | 0.795 | 0.722~0.857 |
| S-Emax | 174.91±72.68 | 72.59±49.75 | 9.713 | <0.001 | >89.76 | 89.06 | 82.76 | 0.72 | 0.900 | 0.840~0.943 |
| S-Emin | 2.86±2.63 | 5.13±3.82 | -4.326 | <0.001 | ≤1.90 | 43.75 | 88.51 | 0.32 | 0.706 | 0.626~0.777 |
| S-Esd | 25.74±11.01 | 11.98±8.22 | 8.416 | <0.001 | >16.25 | 82.81 | 82.81 | 0.66 | 0.871 | 0.807~0.920 |
| A'-Emean | 30.74±11.77 | 23.01±13.06 | 3.748 | <0.001 | >21.52 | 84.37 | 56.32 | 0.41 | 0.714 | 0.635~0.785 |
| A'-Emax | 182.53±72.61 | 78.16±54.65 | 9.661 | <0.001 | >93.64 | 89.06 | 81.61 | 0.71 | 0.893 | 0.832~0.937 |
| A'-Emin | 2.10±2.37 | 4.62±3.71 | -5.081 | <0.001 | ≤1.88 | 60.94 | 85.06 | 0.46 | 0.775 | 0.700~0.839 |
| A'-Esd | 22.13±8.00 | 11.67±7.99 | 7.947 | <0.001 | >15.61 | 81.25 | 81.61 | 0.63 | 0.850 | 0.783~0.903 |
| V(Pa·s) | ||||||||||
| Vmean | 1.50±0.85 | 1.63±1.04 | -0.816 | 0.416 | - | - | - | - | - | - |
| Vmax | 8.03±3.27 | 4.68±2.82 | 6.567 | <0.001 | >4.81 | 82.81 | 71.26 | 0.54 | 0.811 | 0.740~0.870 |
| Vmin | 0.05±0.11 | 0.19±0.27 | -4.357 | <0.001 | ≤0.20 | 95.31 | 41.38 | 0.37 | 0.669 | 0.588~0.744 |
| Vsd | 1.08±0.53 | 0.80±0.47 | 3.380 | 0.001 | >0.87 | 62.50 | 74.71 | 0.37 | 0.676 | 0.595~0.750 |
| S-Vmean | 1.95±0.76 | 1.54±0.70 | 3.423 | 0.001 | >1.62 | 62.50 | 71.26 | 0.34 | 0.688 | 0.608~0.761 |
| S-Vmax | 9.66±3.00 | 5.12±2.64 | 9.854 | <0.001 | >6.31 | 90.62 | 86.21 | 0.78 | 0.887 | 0.825~0.933 |
| S-Vmin | 0.05±0.07 | 0.11±0.15 | -3.305 | 0.001 | ≤0.17 | 98.44 | 25.29 | 0.24 | 0.600 | 0.517~0.679 |
| S-Vsd | 1.50±0.61 | 0.93±0.49 | 6.407 | <0.001 | >1.18 | 70.31 | 83.91 | 0.54 | 0.807 | 0.735~0.867 |
| A'-Vmean | 1.68±0.78 | 1.57±0.74 | 0.840 | 0.402 | - | - | - | - | - | - |
| A'-Vmax | 10.16±3.12 | 5.49±2.95 | 9.375 | <0.001 | >6.35 | 93.75 | 83.91 | 0.77 | 0.878 | 0.815~0.925 |
| A'-Vmin | 0.02±0.06 | 0.09±0.14 | -3.951 | <0.001 | ≤0.07 | 93.75 | 34.48 | 0.28 | 0.627 | 0.545~0.704 |
| A'-Vsd | 1.31±0.52 | 0.91±0.49 | 4.837 | <0.001 | >0.97 | 76.56 | 73.56 | 0.50 | 0.748 | 0.671~0.815 |
| D(m/s/kHz) | ||||||||||
| Dmean | 3.76±2.59 | 3.66±1.91 | 0.245 | 0.807 | - | - | - | - | - | - |
| Dmax | 16.09±3.50 | 11.95±4.61 | 6.273 | <0.001 | >13.98 | 73.44 | 73.44 | 0.42 | 0.757 | 0.681~0.823 |
| Dmin | 0±0.02 | 0.11±0.41 | -2.481 | 0.015 | - | - | - | - | - | - |
| Dsd | 3.20±1.24 | 2.57±1.05 | 3.391 | 0.001 | >2.80 | 60.94 | 66.67 | 0.28 | 0.646 | 0.565~0.722 |
| S-Dmean | 4.54±2.05 | 3.73±1.57 | 2.640 | 0.009 | >5.68 | 31.25 | 90.80 | 0.22 | 0.610 | 0.528~0.688 |
| S-Dmax | 17.81±2.36 | 12.92±4.14 | 9.172 | <0.001 | >15.37 | 85.94 | 71.26 | 0.57 | 0.839 | 0.770~0.893 |
| S-Dmin | 0±0.02 | 0.01±0.04 | -0.801 | 0.424 | - | - | - | - | - | - |
| S-Dsd | 4.06±1.06 | 2.84±1.04 | 7.090 | <0.001 | >3.37 | 71.87 | 78.16 | 0.50 | 0.796 | 0.723~0.858 |
| A'-Dmean | 4.05±2.35 | 3.74±1.66 | 0.910 | 0.365 | - | - | - | - | - | - |
| A'-Dmax | 18.05±2.26 | 13.57±4.18 | 8.466 | <0.001 | >15.38 | 89.06 | 65.52 | 0.55 | 0.820 | 0.749~0.878 |
| A'-Dmin | 0±0.01 | 0±0.01 | -0.749 | 0.455 | - | - | - | - | - | - |
| A'-Dsd | 3.67±1.11 | 2.83±1.03 | 4.826 | <0.001 | >3.03 | 75.00 | 64.37 | 0.39 | 0.714 | 0.634~0.784 |
表4 经弹性和黏弹性最佳诊断参数调整前后的BI-RADS 分类诊断效能比较 |
| 组别 | 3类(例) | 4a类(例) | 4b类(例) | 4c类(例) | 5类(例) | 敏感度(%) | 特异度(%) | 准确性(%) | 约登指数 | AUC | 95%CI | Z值 | P值 |
|---|---|---|---|---|---|---|---|---|---|---|---|---|---|
| 常规超声 | BI-RADS分类 | 68.75 | 86.21 | 80.13 | 0.55 | 0.847 | 0.779~0.900 | - | - | ||||
| 恶性组 | 0 | 19 | 37 | 6 | 2 | ||||||||
| 良性组 | 40 | 36 | 11 | 0 | 0 | ||||||||
| 经S-Emax | 调整后的BI-RADS分类 | 87.50 | 87.36 | 88.08 | 0.75 | 0.902 | 0.843~0.945 | 2.442 | 0.015 | ||||
| 恶性组 | 4 | 3 | 15 | 33 | 8 | ||||||||
| 良性组 | 67 | 10 | 5 | 6 | 0 | ||||||||
| 经S-Vmax | 调整后的BI-RADS分类 | 90.62 | 90.80 | 90.73 | 0.81 | 0.920 | 0.865~0.958 | 3.241 | 0.001 | ||||
| 恶性组 | 4 | 2 | 16 | 34 | 8 | ||||||||
| 良性组 | 68 | 11 | 2 | 6 | 0 | ||||||||
| 经S-Dmax | 调整后的BI-RADS分类 | 87.50 | 83.91 | 84.77 | 0.71 | 0.899 | 0.840~0.942 | 2.083 | 0.037 | ||||
| 恶性组 | 3 | 6 | 16 | 31 | 8 | ||||||||
| 良性组 | 54 | 19 | 8 | 6 | 0 |
| 1 |
Bray F, Laversanne M, Sung H, et al.Global cancer statistics 2022:GLOBOCAN estimates of incidence and mortality worldwide for 36 cancers in 185 countries[J].CA Cancer J Clin, 2024, 74(3): 229-263.
|
| 2 |
Kim S, Tran TXM, Song H, et al.Mammographic breast density,benign breast disease, and subsequent breast cancer risk in 3.9 million Korean women[J].Radiology, 2022, 304(3): 534-541.
|
| 3 |
Mann RM, Cho N, Moy L.Breast MRI: state of the art[J].Radiology,2019, 292(3): 520-536.
|
| 4 |
Sigrist RMS, Liau J, Kaffas AE, et al.Ultrasound elastography: review of techniques and clinical applications[J].Theranostics, 2017, 7(5):1303-1329.
|
| 5 |
Rus G, Faris IH, Torres J, et al.Why are viscosity and nonlinearity bound to make an impact in clinical elastographic diagnosis? [J].Sensors (Basel), 2020, 20(8): 2379.
|
| 6 |
Adler DD, Carson PL, Rubin JM, et al.Doppler ultrasound color flow imaging in the study of breast cancer: preliminary findings[J].Ultrasound Med Biol, 1990, 16(6): 553-559.
|
| 7 |
Xie L, Liu Z, Pei C, et al.Convolutional neural network based on automatic segmentation of peritumoral shear-wave elastography images for predicting breast cancer[J].Front Oncol, 2023, 13:1099650.
|
| 8 |
Jia W, Xia S, Jia X, et al.Ultrasound viscosity imaging in breast lesions: a multicenter prospective study[J].Acad Radiol, 2024, 31(9):3499-3510.
|
| 9 |
谢鹏.基于低频振动的二维超声粘弹性成像方法研究[D].深圳:深圳大学, 2018.
|
| 10 |
Catheline S, Gennisson JL, Delon G, et al.Measuring of viscoelastic properties of homogeneous soft solid using transient elastography: an inverse problem approach[J].J Acoust Soc Am, 2004, 116(6): 3734-3741.
|
| 11 |
Poul SS, Ormachea J, Ge GR, et al.Comprehensive experimental assessments of rheological models’ performance in elastography of soft tissues[J].Acta Biomater, 2022, 146: 259-273.
|
| 12 |
Chen X, Shen Y, Zheng Y, et al.Quantification of liver viscoelasticity with acoustic radiation force: a study of hepatic fibrosis in a rat model[J].Ultrasound Med Biol, 2013, 39(11): 2091-2102.
|
| 13 |
Barry CT, Hazard C, Hah Z, et al.Shear wave dispersion in lean versus steatotic rat livers[J].J Ultrasound Med, 2015, 34(6): 1123-1129.
|
| 14 |
Sugimoto K, Moriyasu F, Oshiro H, et al.The role of multiparametric US of the liver for the evaluation of nonalcoholic steatohepatitis[J].Radiology, 2020, 296(3): 532-540.
|
| 15 |
Jang JK, Lee ES, Seo JW, et al.Two-dimensional shear-wave elastography and US attenuation imaging for nonalcoholic steatohepatitis diagnosis: A cross-sectional, multicenter study[J].Radiology, 2022, 305(1): 118-126.
|
| 16 |
Sugimoto K, Moriyasu F, Oshiro H, et al.Viscoelasticity measurement in rat livers using shear-wave us elastography[J].Ultrasound Med Biol, 2018, 44(9): 2018-2024.
|
| 17 |
Lee DH, Lee JY, Bae JS, et al.Shear-wave dispersion slope from US shear-wave elastography: detection of allograft damage after liver transplantation[J].Radiology, 2019, 293(2): 327-333.
|
| 18 |
Kim TM, Ahn H, Cho JY, et al.Prediction of acute rejection in renal allografts using shear-wave dispersion slope[J].Eur Radiol, 2024,34(7): 4527-4537.
|
| 19 |
王坤, 朱宇莉, 陈凯玲, 等.剪切波频散成像鉴别诊断肝肿瘤良恶性的初步应用[J].中华超声影像学杂志, 2022, 31(6): 518-524.
|
| 20 |
Kumar V, Denis M, Gregory A, et al.Viscoelastic parameters as discriminators of breast masses: Initial human study results[J].PLoS One, 2018, 13(10): e0205717.
|
| 21 |
Sinkus R, Tanter M, Xydeas T, et al.Viscoelastic shear properties of in vivo breast lesions measured by MR elastography[J].Magn Reson Imaging, 2005, 23(2): 159-165.
|
| 22 |
Sinkus R, Tanter M, Catheline S, et al.Imaging anisotropic and viscous properties of breast tissue by magnetic resonance-elastography[J].Magn Reson Med, 2005, 53(2): 372-387.
|
| 23 |
Gautieri A, Vesentini S, Redaelli A, et al.Modeling and measuring visco-elastic properties: From collagen molecules to collagen fibrils[J].Non-Linear Mech, 2013, 56(11): 25-33.
|
| 24 |
Nabavizadeh A, Bayat M, Kumar V, et al.Viscoelastic biomarker for differentiation of benign and malignant breast lesion in ultra- low frequency range[J].Sci Rep, 2019, 9(1): 5737.
|
| 25 |
Su GH, Xiao Y, You C, et al.Radiogenomic-based multiomic analysis reveals imaging intratumor heterogeneity phenotypes and therapeutic targets[J].Sci Adv, 2023, 9(40): eadf0837.
|
| 26 |
Ghatak S, Maytin EV, Mack JA, et al.Roles of proteoglycans and glycosaminoglycans in wound healing and fibrosis[J].Int J Cell Biol,2015, 2015: 834893.
|
| 27 |
Schierbaum N, Rheinlaender J, Schäffer TE.Viscoelastic properties of normal and cancerous human breast cells are affected differently by contact to adjacent cells[J].Acta Biomater, 2017, 55: 239-248.
|
| 28 |
Otesteanu CF, Chintada BR, Rominger MB, et al.Spectral quantification of nonlinear elasticity using acoustoelasticity and shearwave dispersion[J].IEEE Trans Ultrason Ferroelectr Freq Control,2019, 66(12): 1845-1855.
|
| 29 |
Zhou J, Zhan W, Chang C, et al.Breast lesions: evaluation with shear wave elastography, with special emphasis on the “stiff rim” sign[J].Radiology, 2014, 272(1): 63-72.
|
/
| 〈 |
|
〉 |